


Stock Market Approaching Significant Low for a Counter-trend Rally
Stock-Markets / Cycles Analysis Oct 05, 2008 - 06:24 PM GMTBy: Andre_Gratian

 Current Position of the Market
Long-term trend - Down! The very-long-term cycles have taken over earlier than anticipated and if they make their lows when expected, the bear market which started in October 2007 should continue until 2012-2014.
SPX: Intermediate trend - The low of 9/18 was a false alarm. What looked like a potential climactic low at the time could not follow through on the upside. Early to mid-October looks like the best possibility for the end of the first phase of the bear market.
Analysis of the short-term trend is done on a daily basis with the help of hourly charts. It is an important adjunct to the analysis of daily and weekly charts which determines the course of longer market trends.
Daily market analysis of the short term trend is reserved for subscribers. If you would like to sign up for a FREE 4-week trial period of daily comments, please let me know at ajg@cybertrails.com .
Overview:
When the SPX broke below 1201 with a sharp decline followed immediately by a sharp rally, it briefly gave the impression that it might have made the cyclic low that I had been anticipating, but its inability to follow through, and subsequent action over the past two weeks should have completely dissuaded those analysts that had given the market every opportunity to prove that it was only in an extended intermediate correction from October 2007. We are now in a bear market and it will probably turn out to be one of the worst bear markets of the past hundred years.
I had expected the bull market to make one more high in 2009 or 2010 before a collapse into about 2014, which is the time period when some analysts are expecting the 100-yr cycle and its major components to bottom. Instead, the rally which will follow the current decline is now likely to be an a-b-c corrective wave which will fail to make a new high.
It seems that everything came to a head in the past few weeks at an accelerated and unexpected clip which caused the Treasury secretary and the Federal Reserve to panic and ask for the largest bailout package in history. The Ted Spread went from about 1 to just under 4 from the beginning to the end of September, reflecting probably the fastest developing, monstrous credit crunches in U.S. history. The passage of the relief package on Friday was not enough to assuage the fears of investors, and the stock market closed at a new low in almost all of its major averages.
It's anyone's guess if the 6-yr cycle low, which was ideally due in October, will finally end with the erratic, high volume series of rallies and declines which have marked the past two weeks, or in a good old-fashioned capitulation which will wash prices lower before they can turn around. Indicators abound which show that we are about to make an important low, but none can be specific enough to prophesize the exact date. Only the stock market can tell us this by its action.
What's ahead?
Chart pattern and momentum:
When the SPX turned up in July, it began to show some deceleration by refusing to go to the bottom of the channel, giving hope to the possibility that an intermediate low was beginning to take hold. But after a strained rally, prices turned down again and have now penetrated the bottom of their main channel. This is a sign of accelerating weakness which has the possibility of turning into a selling climax over the next few days. When it broke below 1201, the index triggered a projection to about 1060, which also corresponds with a support level (red line). Reaching that target would not be a climax, but if it fails to stop there and panic sets in, it could continue down another 100 points to its next support.
There is another well-defined secondary channel, the one in purple with the bottom trend line slightly lower than where we closed on Friday and, finally, the steepest one, in blue green. Whatever kind of low we make, this is the one that will have to be broken on the upside for a reversal to begin. Next, prices will have to move above the 1270 red horizontal line, followed by a break above the purple line, etc...
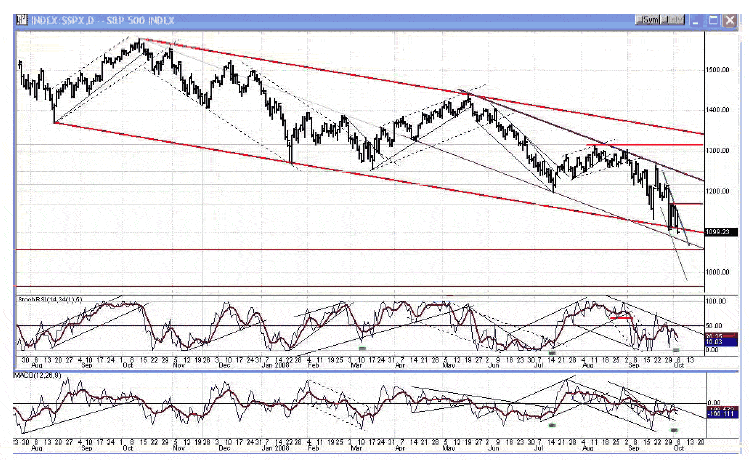
Note that both indicators are showing positive divergence with the strongest being in the A/D indicator (bottom). It would be easy to get caught up in the market negativity and think "They will fail, this time", and it might turn out to be correct, but these green alerts have such a high level of accuracy at calling bottoms that they should not be dismissed lightly.
Cycles
The 7-year cycle probably bottomed a week ago Thursday at 1133.5, and the 6-yr cycle is expected to make its low in October with the date most mentioned being October 10. Coincidentally, I have a minor cycle due on 10/7-8.
Also coming up is the 20-wk cycle which is due in 2-3 weeks
Projections:
There is a potential projection to about 1060 which corresponds with a former support level.
Breadth
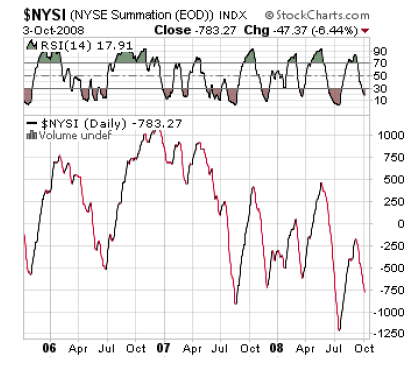
As you can see below, the McClellan oscillator (courtesy of StockCharts) is currently at a higher level than at its former low, while the NYSE Composite, SPX and Dow Industrials all closed at new lows.
If we consider the NYSE Summation index to be an intermediate indicator, as of Friday there was positive divergence in A/D indicators for all time frames: intermediate, daily, and hourly. It may not mean anything, but it warrants paying close attention to what the market does on Monday and in the next couple of days!
Market Leaders and Sentiment
I don't have the back history of this indicator, but the Sentiment Trader intermediate indicator is the most bullish since I started to follow it a few months ago, while the short-term is moderately bullish.
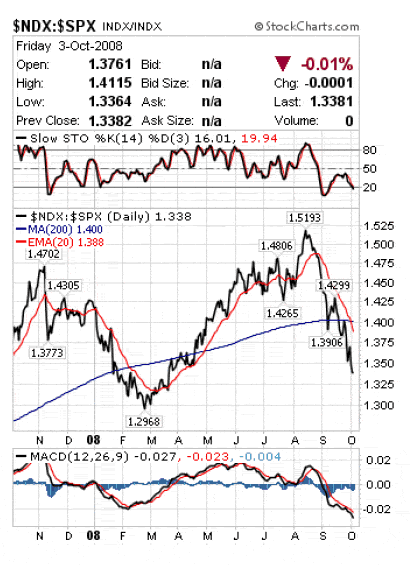
Short-term, the NDX/SPX ratio below (courtesy of StockCharts) is still dropping, but note that the Slow STO is oversold, making a double-bottom with the second bottom higher (positive divergence). Also note that the MACD histogram is doing the same thing! Is the NDX about to get stronger relative to the SPX? That would be bullish!
Summary
Conditions have deteriorated dramatically in the past two weeks, confirming that we are in a bear market which could continue for several more years if the 100-yr cycle and its major components bottom in their allotted times.
There are also many signs that we are approaching the end of the first down phase. A reversal should be followed by a counter-trend rally lasting several months.
The following are examples of unsolicited subscriber comments:
What is most impressive about your service is that you provide constant communication with your subscribers. I would highly recommend your service to traders. D.A.
Andre, you did it again! Like reading the book before watching the movie. B.F.
I would like to thank you so much for all your updates/newsletters. As I am mostly a short-term trader, your work has been so helpful to me as I know exactly when to get in and out of positions. I am so glad I decided to subscribe to Turning Points… Please rest assured that I shall continue to be with Turning Points for a long time to come. Thanks once again! D.P.
But don't take their word for it! Find out for yourself with a FREE 4-week trial. Send an email to ajg@cybertrails.com .
By Andre Gratian
MarketTurningPoints.com
A market advisory service should be evaluated on the basis of its forecasting accuracy and cost. At $25.00 per month, this service is probably the best all-around value. Two areas of analysis that are unmatched anywhere else -- cycles (from 2.5-wk to 18-years and longer) and accurate, coordinated Point & Figure and Fibonacci projections -- are combined with other methodologies to bring you weekly reports and frequent daily updates.
“By the Law of Periodical Repetition, everything which has happened once must happen again, and again, and again -- and not capriciously, but at regular periods, and each thing in its own period, not another’s, and each obeying its own law … The same Nature which delights in periodical repetition in the sky is the Nature which orders the affairs of the earth. Let us not underrate the value of that hint.” -- Mark Twain
You may also want to visit the Market Turning Points website to familiarize yourself with my philosophy and strategy.www.marketurningpoints.com
Disclaimer - The above comments about the financial markets are based purely on what I consider to be sound technical analysis principles uncompromised by fundamental considerations. They represent my own opinion and are not meant to be construed as trading or investment advice, but are offered as an analytical point of view which might be of interest to those who follow stock market cycles and technical analysis.
Andre Gratian Archive |
© 2005-2022 http://www.MarketOracle.co.uk - The Market Oracle is a FREE Daily Financial Markets Analysis & Forecasting online publication.