


Stock Bottom Reached? Don’t Bet the Farm Just Yet
Stock-Markets / Stock Markets 2020 Feb 04, 2020 - 01:08 PM GMTBy: P_Radomski_CFA

As the markets grapple with the coronavirus story, the stock market is no exception. Jittery and volatile trading is what we’ve seen on Friday, January 24 already. In the heat of the moment, it’s easy to sell first and ask questions later. But times like these call for stepping back and evaluating the technical picture across several timeframes instead.
That’s exactly what we’ll do, starting with the monthly chart. Before jumping right into the chart to examine what January brought us (charts courtesy of http://stockcharts.com), it’s my pleasure to employ my experience and analytical views to your benefit – both within Stock Trading Alerts and Oil Trading Alerts. You can learn more about me by taking a look at my bio.
Let’s take a look at what January brought us (charts courtesy of http://stockcharts.com).
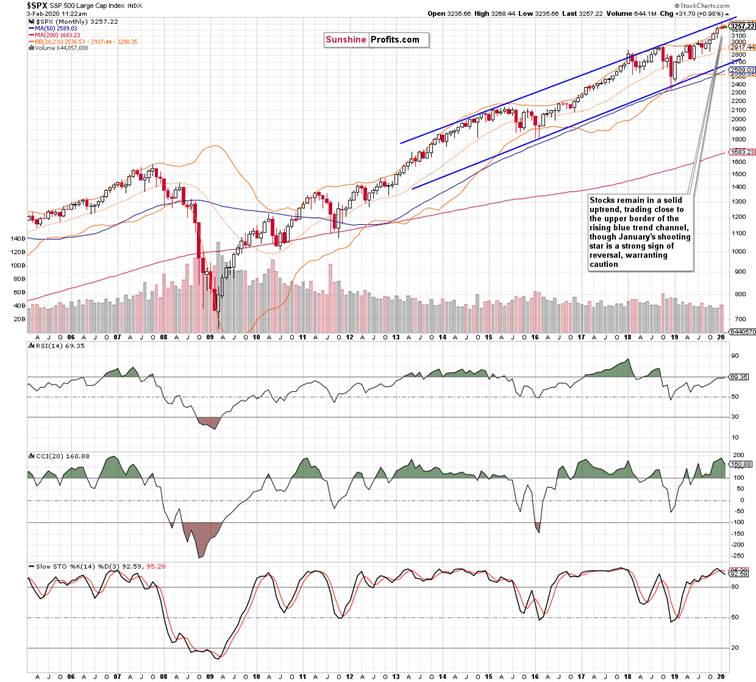
Since breaking above their pre-Great Recession highs back in 2013, S&P 500 has been trading solidly higher. Price action has been confined within the rising blue trend channel. While the long-term stock market bull has been punctured by sideways trading and an occasional sharp correction, prices have continued making new highs.
While January closed with a shooting star, there is no sign of a market top being in just yet. But as shooting stars belong among reversal patterns, caution is warranted. Higher January volume also highlights the possibility of more downside action to come.
The monthly indicators though support uptrend continuation, and so do the rising moving averages. While it’s true that Stochastics just flashed its sell signal, it happened in its overbought territory. And that’s an area where acting on such signals leads to frequent whipsaws. That’s why some traders prefer to wait for Stochastics to leave overbought territory first, and act on its buy signals only then. All in all, the monthly indicators continue to point in the direction of new highs to be made down the road.
Let’s assess the weekly perspective now.
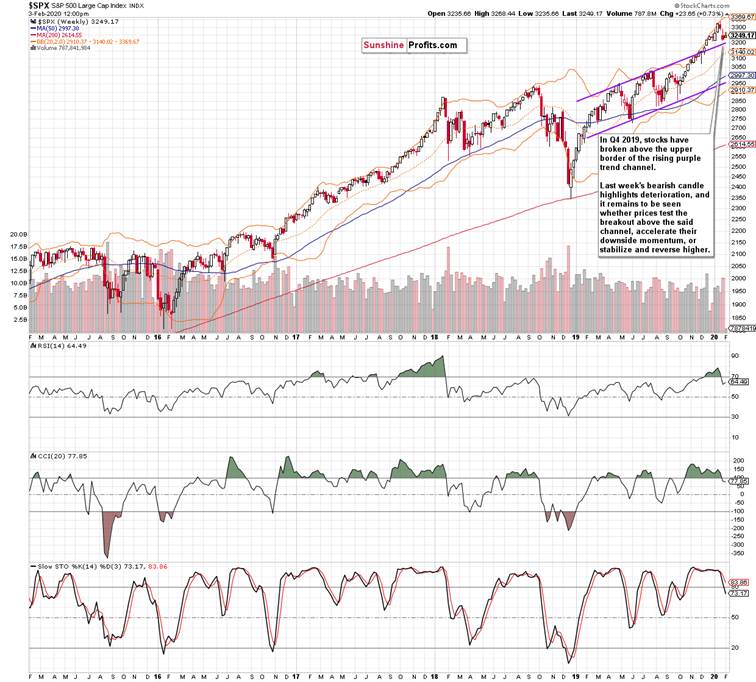
The first thing that catches the eye, is the November 2019 breakout above the upper border of the rising purple trend channel. Since retesting its lower border in September, stocks haven’t looked back and marched higher.
But two weeks ago, the bulls couldn’t keep their gains any more. Stocks ended lower, yet still within spitting distance of previous highs. Last week’s open marked by the sizable bearish gap that the bulls couldn’t close later in the week, showed clear deterioration. Prices reversed lower, and the bears finished the week on a strong note near the weekly lows.
Additionally, the rising trend channel’s upper border is near, and this week will provide more clues as to whether stocks test it, break below it, or reverse higher.
The weekly indicators’ posture has deteriorated, with both RSI and CCI leaving their overbought territories. While Stochastics has as well issued its sell signal, it’s still in the overbought area where signals can lead to frequent whipsaws.
Such accelerating price action spells caution. Earlier today, the Chinese markets opened after being closed the whole previous week, as their New Year holidays are over. Their selloff was feared to be much steeper than the 7.7% Shanghai Composite fell, and the $174bn liquidity injection pledge by the Chinese government certainly helped in achieving that outcome. Following these developments, S&P 500 futures are trading slightly higher at around 3240 as we speak.
We’ll be closely watching the situation – the most likely scenario currently appears to be selloff’s continuation.
Let’s finetune the short-term picture with the daily chart.
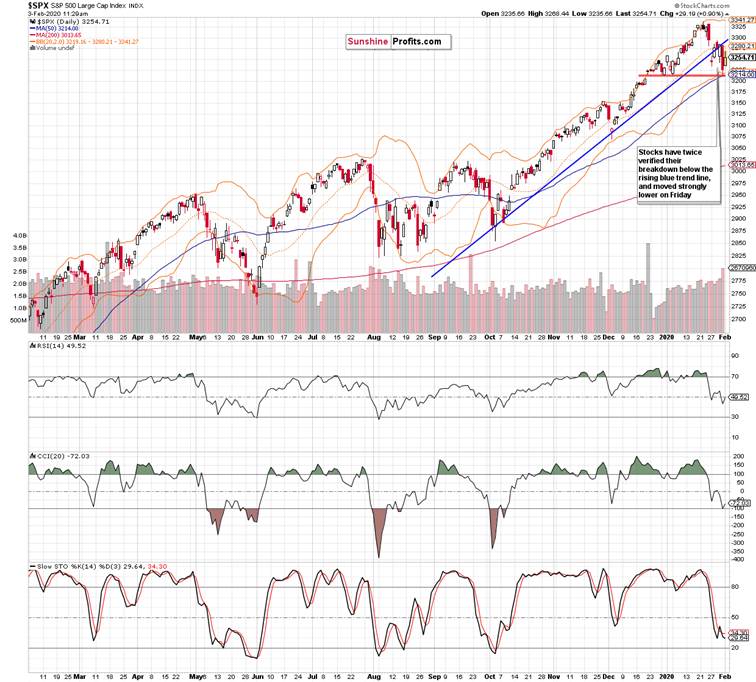
Having opened last Monday below the rising blue trend line, the bulls tried hard to invalidate the breakdown below it. They failed, and prices rolled over to the downside. This way, the preceding upswing was nothing more than verification of the preceding breakdown.
Friday’s downswing happened on high volume, pointing to further likely decline. The daily indicators are approaching their oversold territory, and more deterioration is a distinct possibility. Stochastics just invalidated its earlier buy signal – but this signal alone wasn’t to be taken on its face value and acted upon in the absence of more signs pointing to the bulls’ strength.
The red support zone coupled with the 50-day moving average could provide some help to the bulls. On Friday, it has stopped the decline as seen in the candle’s lower shadow.
As we are in a bull market and haven’t yet seen reliable signs of a market top, corrections are to be bought. Taking into account the deterioration on both weekly and daily charts, staying on the sidelines is the right course of action until an opportune entry point on the long side emerges. From the risk-reward perspective, this hasn’t happened yet.
Summing up, the S&P 500 ran into serious headwinds last week, and has powerfully rolled over to the downside. The supports on both the weekly and daily charts are close, and withstood the first test in Friday’s selling. The short-term picture has deteriorated though as evidenced by both the weekly and daily indicators. After being closed for the whole week, China’s markets have declined less than feared, translating into the S&P 500 futures trading modestly higher before the US market open. From the risk-reward perspective, it’s prudent to stay on the sidelines and look for reliable signs of bulls’ strength to emerge. This means that we’re eyeing a favorable setup to get back in on the long side as the stock bull market is alive and well. The strong monthly chart shows no hint of a top being made.
If you enjoyed the above analysis and would like to receive daily premium follow-ups, we encourage you to sign up for our Stock Trading Alerts to also benefit from the trading action we describe – the moment it happens. The full analysis includes more details about our current positions and levels to watch before deciding to open any new ones or where to close existing ones. Check more of our free articles on our website – just drop by and have a look. We encourage you to sign up for our daily newsletter, too - it's free and if you don't like it, you can unsubscribe with just 2 clicks. If you sign up today, you'll also get 7 days of free access to our premium daily Stock Trading Alerts as well as our other Alerts. Sign up for the free newsletter today!
Thank you.
Monica Kingsley
Stock & Oil Trading Strategist
Sunshine Profits - Effective Investments through Diligence and Care
Monica Kingsley is a trader and financial markets analyst. Apart from diving into the charts on a daily basis, she is very much into economics, marketing and writing as well. Naturally, she has found home at Sunshine Profits - a leading company that has been publishing quality analysis for more than a decade. Sunshine Profits has been founded by Przemyslaw Radomski, CFA - a renowned precious metals investor and analyst.
Disclaimer
All essays, research and information found above represent analyses and opinions of Przemyslaw Radomski, CFA and Sunshine Profits' associates only. As such, it may prove wrong and be a subject to change without notice. Opinions and analyses were based on data available to authors of respective essays at the time of writing. Although the information provided above is based on careful research and sources that are believed to be accurate, Przemyslaw Radomski, CFA and his associates do not guarantee the accuracy or thoroughness of the data or information reported. The opinions published above are neither an offer nor a recommendation to purchase or sell any securities. Mr. Radomski is not a Registered Securities Advisor. By reading Przemyslaw Radomski's, CFA reports you fully agree that he will not be held responsible or liable for any decisions you make regarding any information provided in these reports. Investing, trading and speculation in any financial markets may involve high risk of loss. Przemyslaw Radomski, CFA, Sunshine Profits' employees and affiliates as well as members of their families may have a short or long position in any securities, including those mentioned in any of the reports or essays, and may make additional purchases and/or sales of those securities without notice.
© 2005-2022 http://www.MarketOracle.co.uk - The Market Oracle is a FREE Daily Financial Markets Analysis & Forecasting online publication.