


Stock Performance in the Rising Coronavirus Fever
Stock-Markets / Stock Markets 2020 Feb 28, 2020 - 02:01 PM GMTBy: P_Radomski_CFA

The bulls didn’t really get their act together yesterday, and the early gains evaporated a few hours into the session. As stocks closed near their daily lows, what chances of invalidating Tuesday’s breakdown below the important support do the buyers have?
Let’s briefly check what kind of progress the bears made yesterday on the weekly chart (charts courtesy of http://stockcharts.com).
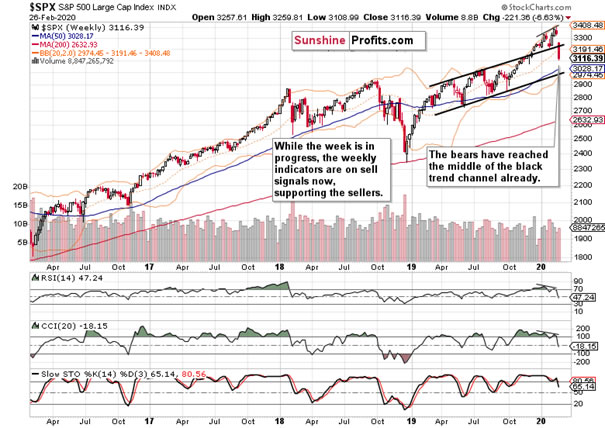
Having reached its midpoint, the bears are cutting ever deeper into the rising black trend channel. Our yesterday’s observations ring as true today as they did yesterday:
(…) Yesterday’s slide turned the weekly indicators’ sell signals even more into negative territory. The bulls woefully failed to lift prices and this week’s sizable bearish gap stands unchallenged. Both the gap and the indicators continue to support the bears.
The preceding divergencies are still being resolved. Let’s quote our Monday’s observations when we discussed the comparison between:
(…) the levels of both of these indicators with the price action. Stocks have been rising while both the RSI and CCI made lower highs. You can see it marked on the above chart with thin black lines. We have two divergences here – in other words, they didn’t confirm the price advance.
Now, let’s focus on yesterday’s session on the daily chart below.
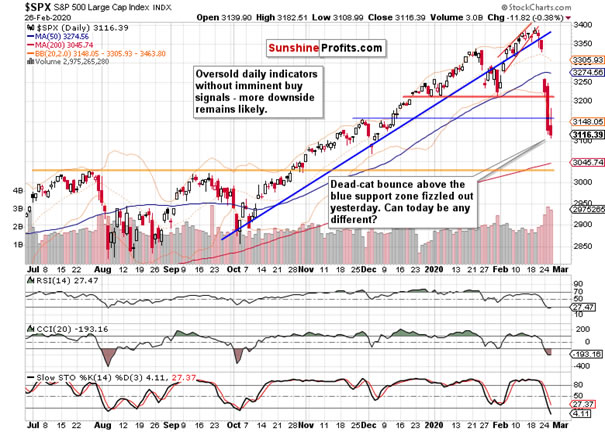
Despite the bullish opening gap and the buyers keeping momentum for a few hours after yesterday’s open, stocks rolled over to the downside. As the index was giving up its opening gains, we’ve sent a quick intraday Alert to our subscribers, telling them about our decision to jump in on the short side.
And as you can see on the chart above, it was a profitable trading move. Especially if you take a look at today’s premarket action – after yesterday’s 3117 close, the futures are quoted at 3085 currently, and set to open with yet another bearish gap today. More power to the sellers.
We’ve seen another overnight bounce that fizzled out. The bulls made it to 3104, but were unable to keep gained ground again. Looks like one more dead-cat bounce that’s over.
There are quite a few reasons for why this slide has more to go.
Yesterday, we have commented extensively on the coronavirus. Let’s recall the key aspects and build up on them:
(…) As stocks started their recovery earlier in February, it was driven by the widespread assessment that coronavirus would be contained and dealt with within China. That has clearly not happened and there’re multiple signs that the crisis is far from over. So are its economic costs and supply chain disruptions.
Let’s recount the facts. The Iranian coronavirus strain is different from the Wuhan one, highlighting its ability to mutate. We now face self-sustaining outbreaks around the world. Just how have they leapfrogged the harsh quarantines in China? The fear around the world is palpable and the US is starting to catch up. Incidentally, the CDC announcement that it’s a question of when rather than if coronavirus reaches America, poured fuel to the fire.
And the array of industries affected by the hits to their production and logistics lines is growing. That affects both product rollouts and earnings expectations. We’ve seen that earlier e.g. with Apple. The virus fallout is growing, and the narrative has taken over the market place. US – China trade war or other issues are very much on the back burner now. Unless the central banks step in more aggressively, the virus fallout recognition will rule the day.
While the bets on Fed rate cuts coming soon have increased, we haven’t seen any shift attributable to coronavirus in Fed governors’ rhetorics just yet. As the charts below (courtesy of Google Trends) show, the US still remains relatively complacent on coronavirus compared to the rest of the world. Human nature is universal, and once confirmed positives start cropping up, the Americans’ fear level will move higher as well.
And taking into account that the second wave of spike in fears is virtually guaranteed to surpass the first one, we’ve quite a way to go in the States. With the speading count of infections in various countries, the world is becoming recognized as coronavirus’ oyster now. And this would bring more attention and consequences than when it was perceived as a China affair only.
Have you seen the Trump and coronavirus Task Force press conference? Assurances and hints that the impact on the American people would be low. Knock-on effects appear being downplayed. That doesn’t square off with the CDC’s Nancy Messonier point on inevitability of community outbreaks, perceived lack of functioning testing kits on the ground, or the Atlanta airport GM saying that 200 passengers showing coronavirus symptoms being just told to self-quarantine…
Orange County declared emergency. Michigan is monitoring over 300 people for coronavirus but zero have been tested. In public consciousness, this has further to go before true panic has been reached. The reality is currently only starting to be recognized, there’s still some denial present in the mix. Burying head in the sand, if you will.
Fundamentally, we haven’t yet seen earnings impact. The same goes for mounting supply chain disruptions. Consumer confidence still remains high. So do sales. That’s the low-hanging fruit…
It should not come as a surprise, that the risk-off trade is hotly pursued.
Let’s explore its two leading metrics – we’ll start with US Treasuries examination.
On the long end of the curve, there is the 30-year bond. Its yield has been plunging to new lows. That’s what happens when there’s high demand for the bond – its yield goes down as the holders demand a higher price to part with the bond. See for yourself the below chart.
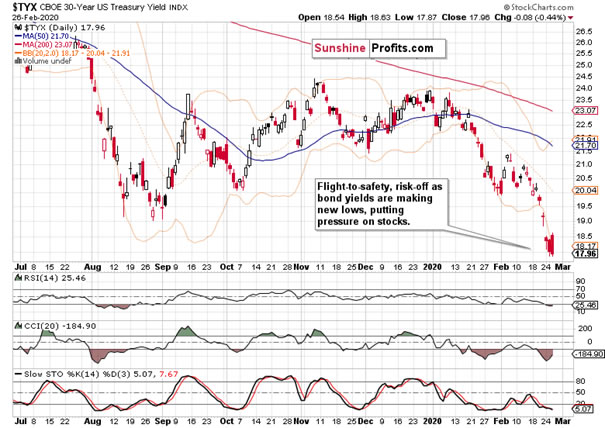
It indicates fear, which puts pressure on risk-on assets such as stocks. We are talking stocks as a whole, the full spectrum – not the defensive ones such as healthcare, consumer staples or utilities – these usually perform better than their more sensitive peers in such times.
Another way to assess the flight-to-safety trade, is to look at the performance of Japanese yen. Similarly to Swiss franc, it acts as a safe-haven currency. These currencies rise as investors seek refuge, making even the mighty dollar suffer.
Remember, these are the carry trade currencies. Their negative yields serve as the incentive for traders to borrow in them, turn around and invest into yield-bearing assets elsewhere – be it the safety of Treasuries or various emerging markets’ assets. These no-brainer trader work just great – until they don’t. Unwinding these investments weighs on heavily on the markets.
So, let’s see how the Japanese yen (both a safe-haven and carry trade currency) has been doing lately:
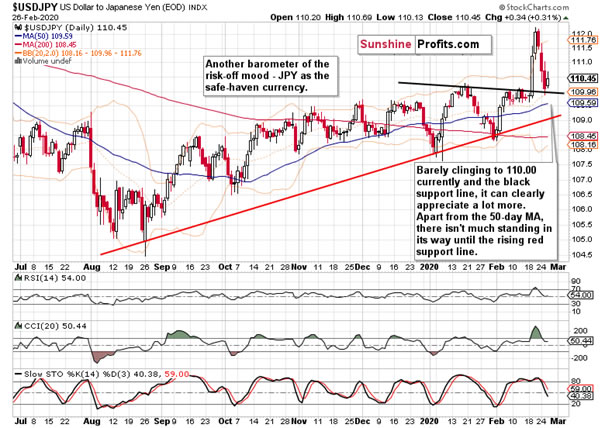
Breaking below the declining black trend line appears to be a question of a relatively short time. The daily indicators clearly favor more downside. The 50-day moving average or the rising red trend line can give the bulls the reason to step in, as yesterday’s rally has clearly fizzled out.
Either way, there’s quite some way to go on the downside. Fundamentally speaking, that would provide stiff headwind to stocks – just as the falling bond yields do.
Let’s turn again to our yesterday’s words:
(…) Downside moves during bull markets are here to either scare you out, or wear you out. This is the formed case. Let’s remember the big picture though – we’re in a stock bull market, actually the longest-running one, and there’re sizable gains ahead to enjoy down the road.
That’s true despite all the damage we would see on the monthly chart when February is over, but arguably, we’ve not yet reached the moment of blood in the streets. Yesterday’s notable absence of the bulls is a not-so-subtle proof of that.
While it’s true that markets and forward-looking and discounting mechanisms, they appear not to have yet digested the coronavirus impact whose count is rising day-by-day.
Taking all the above into account, our profitable short position remains justified (position details are reserved for our subscribers) and unless we see a true game changer, rallies are to be viewed with suspicion. In the current environment, we aim to ride the very likely downswing all the way to the next important support and possibly beyond. Depending on the commitment of the bulls and breaking announcements, we’ll manage our open trade accordingly.
Summing up, the medium-term S&P 500 outlook has shifted to bearish, and more downside remains probable before this correction is over both in time in in price. Both the daily and weekly charts attest to that. The divergencies between RSI, CCI and stock prices aren’t yet finished being resolved to the downside. The slide continues and all we’ve been getting, were dead-cat bounces. While the daily volatility is at recent record highs, the weekly one still has a way to go. The failures of the bulls throughout the week favors more downside before the panic selling is over – and we aim to milk it for what it’s worth. We’ve not yet seen a catalyst that would facilitate the reversal higher, and buy-the-dip mentality doesn’t seem to be a winning proposition these days. While the stock bull market remains intact in the long term, it appears too early to bet on letting its many long-term bullish factors work to our benefit.
We encourage you to sign up for our daily newsletter- it's free and if you don't like it, you can unsubscribe with just 2 clicks. If you sign up today, you'll also get 7 days of free access to our premium daily Stock Trading Alerts as well as our other Alerts. Sign up for the free newsletter today!
Thank you.
Monica Kingsley
Stock & Oil Trading Strategist
Sunshine Profits - Effective Investments through Diligence and Care
Monica Kingsley is a trader and financial markets analyst. Apart from diving into the charts on a daily basis, she is very much into economics, marketing and writing as well. Naturally, she has found home at Sunshine Profits - a leading company that has been publishing quality analysis for more than a decade. Sunshine Profits has been founded by Przemyslaw Radomski, CFA - a renowned precious metals investor and analyst.
Disclaimer
All essays, research and information found above represent analyses and opinions of Przemyslaw Radomski, CFA and Sunshine Profits' associates only. As such, it may prove wrong and be a subject to change without notice. Opinions and analyses were based on data available to authors of respective essays at the time of writing. Although the information provided above is based on careful research and sources that are believed to be accurate, Przemyslaw Radomski, CFA and his associates do not guarantee the accuracy or thoroughness of the data or information reported. The opinions published above are neither an offer nor a recommendation to purchase or sell any securities. Mr. Radomski is not a Registered Securities Advisor. By reading Przemyslaw Radomski's, CFA reports you fully agree that he will not be held responsible or liable for any decisions you make regarding any information provided in these reports. Investing, trading and speculation in any financial markets may involve high risk of loss. Przemyslaw Radomski, CFA, Sunshine Profits' employees and affiliates as well as members of their families may have a short or long position in any securities, including those mentioned in any of the reports or essays, and may make additional purchases and/or sales of those securities without notice.
© 2005-2022 http://www.MarketOracle.co.uk - The Market Oracle is a FREE Daily Financial Markets Analysis & Forecasting online publication.