


Is the Stock Bulls' Cup Half-Full or Half-Empty?
Stock-Markets / Stock Markets 2020 Jun 06, 2020 - 01:57 PM GMTBy: Paul_Rejczak

Neither on Monday, nor on Tuesday did we see strong volume, but prices rose regardless –is it time to bet the farm on higher stocks right next? As quite a few yesterday-mentioned reasons to be cautious were resolved bullishly, the buyers' case got stronger.
S&P 500 in the Short-Run
Let’s start with the daily chart perspective (charts courtesy of http://stockcharts.com ):
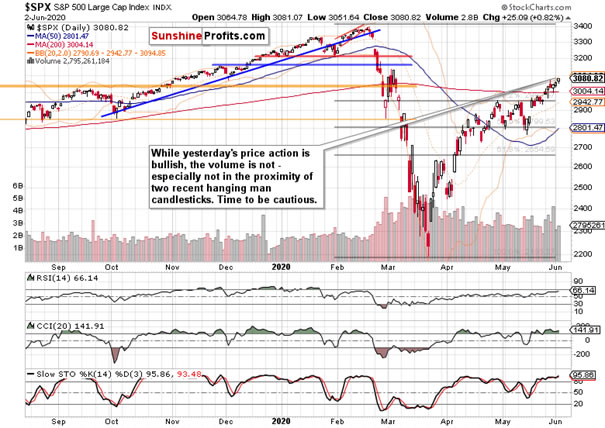
Whatever the adverse intraday setup, prices are grinding slowly higher (even if that happens only in the session's last 15 minutes) – regardless of volume that isn't totally convincing. On a slighly bullish note, yesterday's volume didn't at least decline below Monday's levels. Yes, it's true that somewhat lower volume on many days during bull market runs is no reason for concern, but such low ones give a reason to think that more market participants are waiting for more advantageous prices, and are holding off from buying here.
These were my thought about the short-term stock trading path ahead:
(…) Should it break higher from here, and leave the further detailed non-confirmations unresolved, that would be concerning for the short-term prospects of the bull market. With the early March highs at 3137, the upside potential isn't huge – it's roughly the same as any temporary drop below 3000. That's not what I would call either a high-odds setup to reach those highs, or a favorable risk-reward ratio.
(…) Yes, the monthly price action is bullish, and the weekly one is probing a key resistance, but I think it's a matter of relatively short time when the sellers test the buyers' resolve here.
Stocks are surely working hard to extend their gains, and some of the reasons to be cautious, got resolved yesterday. Are they strong enough to justify being invested?
The Credit Markets’ Point of View
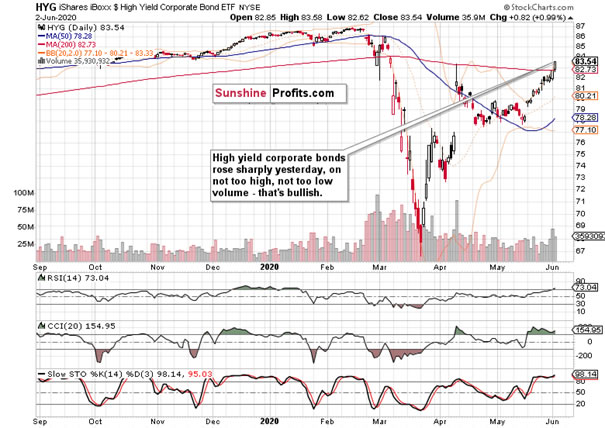
High yield corporate bonds (HYG ETF) weren't a cause for concern either on Monday or yesterday. The long white candlestick speaks for itself. Volume is not too hot, not too cold – and the price action continues being not merely bullish, but strongly bullish. Have stocks resolved their slight short-time lag behind credit yesterday?
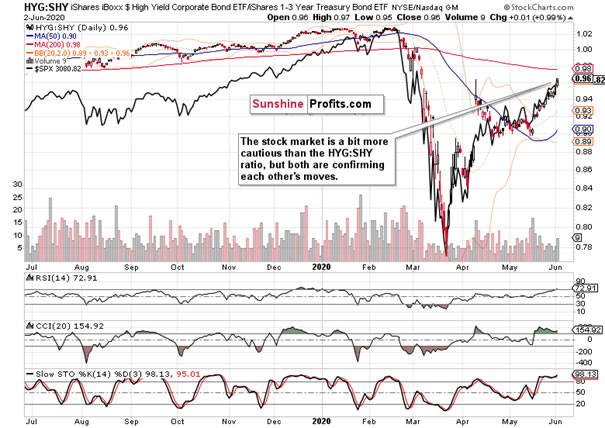
Yesterday's sizable upswing in the ratio wasn't met with a proportional daily increase in stocks. While stocks caught up in yesterday's premarket upswing, the high yield corporate bonds to short-term Treasuries ratio (HYG:SHY) outdid them.
Given that stocks are higher again in the premarket session today, the credit markets' gains would be the driver of further stock increases. That's the message as credit markets retook leadership from stocks on a short-term note as well (the medium-term degree of strong interconnectedness is obvious).
The stock bull run remains intact regardless of whatever short-term hiccups the credit markets are going to run into over the coming days and weeks. The market isn't doubting now whether the Fed has its back or not – it has.
Key S&P 500 Sectors in Focus
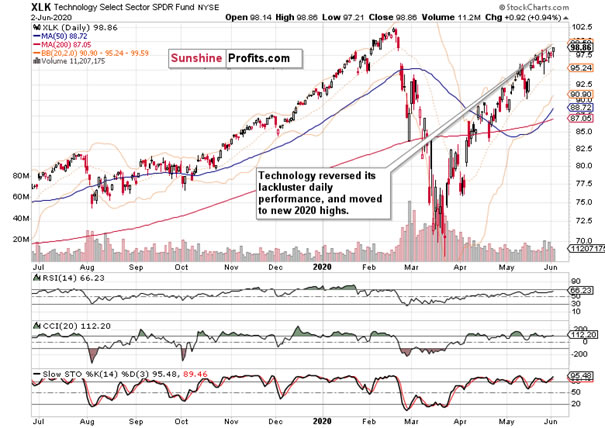
Technology (XLK ETF) wavered intraday, and just as the S&P 500, the sector moved strongly higher only 15 minutes before the closing bell. The price action is turning more positive for the bulls in the short term (it's common knowledge I'm bullish on the sector in the medium and long run).
Encouragingly, its key segment is leading higher. Enter semiconductors.
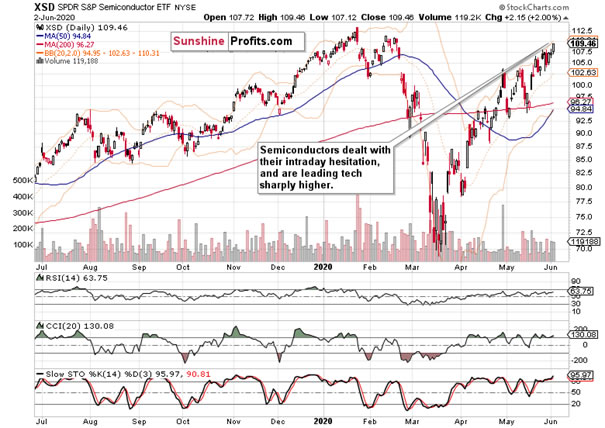
Initially, semiconductors (XSD ETF) had issues overcoming its recent highs yesterday, but steadily worked their way higher to close with a buying climax as well.
As a result, the short-term hesitation in the tech sector appears over.
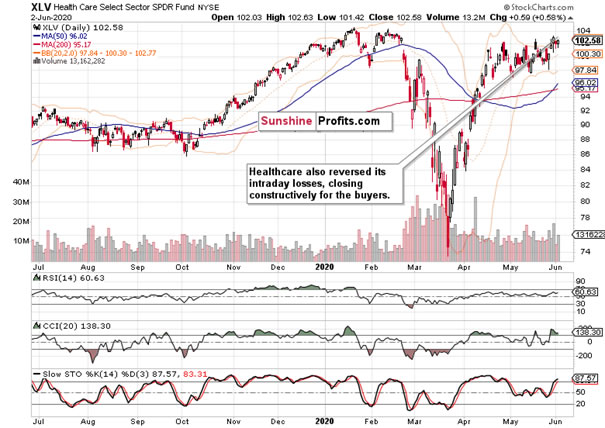
Healthcare (XLV ETF) also erased the daily downswing, and remains positioned for more gains.
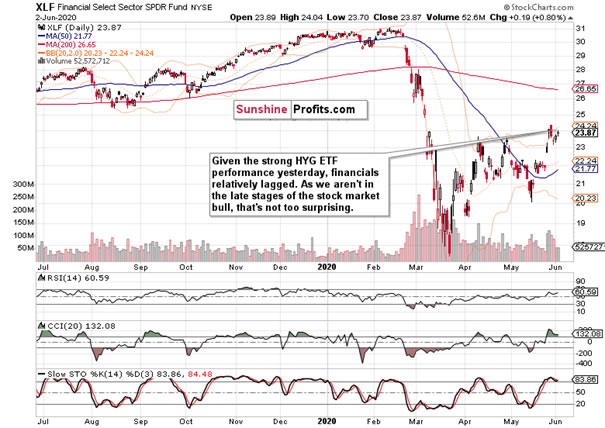
The price action in financials (XLF ETF) wasn't as bullish yesterday. On one hand, they could have moved higher thanks to the HYG ETF upswing, but this early in the stock market bull, the sector can't be really counted upon to outperform.
The performance of the stealth bull market trio is supportive of more stock gains ahead. Materials (XLB ETF) and energy (XLE ETF) moved above their recent highs, with only industrials (XLI ETF) lagging a bit behind. The overall impression of these three sectors remains to be one of a slow grind higher in the weeks to come.
The Fundamental S&P 500 Outlook
On a fundamental note, China hasn't really escalated the issues raised during Friday's Trump press conference. After an intraday drop early this week driven by their agricultural purchases reconsiderations, the statement has been largely contradicted by action on the ground. Stocks cheered that, as it appears that it's only China and foremost the Fed's printing press, that are the stock market kryptonites. The window for unreasonable reactions on both sides has rather closed, and the many issues are back on simmer.
Cool heads prevailed and the downside risk was removed, which means more power the bulls.
As for today's ADP Non-Farm Payrolls, they beat estimates to the upside. Given the mayhem in unemployment claims, a loss of 2760K jobs is less bad than the market thought it would be. When the CARES Act job protection provisions run out later in June, I expect renewed higher intial jobless claims figures though. But we're not there yet.
From the Readers' Mailbag
Q: On the daily charts, what do you think about rising bearish wedge which will be completed latest by Friday? Also VIX uptrend since April? It's clear as daylight and seems like no one brings these to their articles. Same rising bearish wedge happened on every major market crash on every major indexes. What do you think is gonna happen after Friday the latest?
A: Yes, the technical formation is in progress, but as it hasn't been activated yet (stocks didn't break down from it yet). The next couple of sessions will be telling. Ideally, I would like to see the index break down only to come back (a good-bye kiss of the wedge's lower border) on distinctly lower volume, to give it a really bearish kick. So would a fundamental catalyst, but I covered the lack of these already. Stocks appear not to be too concerned about riots anymore…
Otherwise, the drop can be resolved with a few dozen points' drop, and proceed to draw a saucer-like bottom (that's similar to the cup-and-handle pattern bottom) before continuing higher as if nothing happened.
As for VIX, the volatility measure seems to be more in a downtrend that's merely punctured by a few spikes here and there.
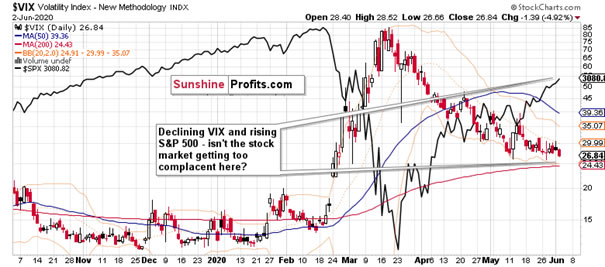
Certainly stocks look extended at first sight, but remember that most bull runs happen on low volatility. Stocks just rise slower than they fall. Then, I think that the recent downswing means that the S&P 500 is getting a bit too complacent now, and look for this metric to rise eventually. Eventually, that's the key words here, as this gives no clarity to the timing part of your question – markets can stay complacent for long periods of time only to move vigorously faster than you can say Jack Robinson.
Summary
Summing up, yesterday's upswing dealt with quite a few signs of short-term non-confirmation, strengthening the bullish case. The strong showing of the high yield corporate bonds is the strongest bullish factor, and the sectoral examination (technology with focus on semiconductors, and the early bull market trio of energy, materials and industrials) support the view. As we're in a bull market, the balance of risks in the medium-term remains skewed to the upside – despite the proximity of early March top and likely probe of the buyers' strength on that occasion.
If you enjoyed the above analysis and would like to receive daily premium follow-ups, we encourage you to sign up for our Stock Trading Alerts to also benefit from the trading action we describe – the moment it happens. The full analysis includes more details about our current positions and levels to watch before deciding to open any new ones or where to close existing ones. Check more of our free articles on our website – just drop by and have a look. We encourage you to sign up for our daily newsletter, too - it's free and if you don't like it, you can unsubscribe with just 2 clicks. If you sign up today, you'll also get 7 days of free access to our premium daily Stock Trading Alerts as well as our other Alerts. Sign up for the free newsletter today!
Thank you.
Monica Kingsley
Stock & Oil Trading Strategist
Sunshine Profits - Effective Investments through Diligence and Care
Monica Kingsley is a trader and financial markets analyst. Apart from diving into the charts on a daily basis, she is very much into economics, marketing and writing as well. Naturally, she has found home at Sunshine Profits - a leading company that has been publishing quality analysis for more than a decade. Sunshine Profits has been founded by Przemyslaw Radomski, CFA - a renowned precious metals investor and analyst.
Disclaimer
All essays, research and information found above represent analyses and opinions of Przemyslaw Radomski, CFA and Sunshine Profits' associates only. As such, it may prove wrong and be a subject to change without notice. Opinions and analyses were based on data available to authors of respective essays at the time of writing. Although the information provided above is based on careful research and sources that are believed to be accurate, Przemyslaw Radomski, CFA and his associates do not guarantee the accuracy or thoroughness of the data or information reported. The opinions published above are neither an offer nor a recommendation to purchase or sell any securities. Mr. Radomski is not a Registered Securities Advisor. By reading Przemyslaw Radomski's, CFA reports you fully agree that he will not be held responsible or liable for any decisions you make regarding any information provided in these reports. Investing, trading and speculation in any financial markets may involve high risk of loss. Przemyslaw Radomski, CFA, Sunshine Profits' employees and affiliates as well as members of their families may have a short or long position in any securities, including those mentioned in any of the reports or essays, and may make additional purchases and/or sales of those securities without notice.
© 2005-2022 http://www.MarketOracle.co.uk - The Market Oracle is a FREE Daily Financial Markets Analysis & Forecasting online publication.