


XLF Financial Sector Stocks Under Pressure and What It Means
Companies / Banking Stocks Jun 15, 2020 - 07:47 PM GMTBy: Chris_Vermeulen

The Financial sector is unique in that it is an essential component of global economics as well as local economic functions. Consumers depend on banking services, credit, and all sorts of other financial services in their day-to-day lives. The Financial sector is one of the components of the US stock market that can suddenly find itself under pricing pressure as an economic crisis event unfolds. This happens because banks earn a large portion of their income from servicing debt and originating loans.
The recent rally in the Financial sector, over 47% from the March 2020 lows, has reached our proprietary Fibonacci price modeling system’s upside price targets and has also filled a major gap that was created in early March 2020. Because of these factors, and the current downside price rotation within the Financial Sector, we believe this component of the US stock market could continue to see extended pricing pressure going forward as we learn just how damaging the past 70+ days of the economic shutdown have been for the economy.
We do know that certain consumers have quickly begun to pay off credit card debt. We believe this is a learned trait from the 2008-09 market crisis where credit card rates skyrocketed as large numbers of consumers began defaulting on their homes and other types of credit. We also know that delinquencies for autos and other sub-prime credit services have begun to skyrocket higher. The sub-prime credit market is vastly different than it was in 2008-09. Recently, Fintech and other new resources have allowed for extended sub-prime lending and leveraging within the US (Source: cnbc.com).
When you combine the sub-prime mortgage, auto, personal loans, personal Fintech margin capabilities, and sub-AAA corporate debt levels, the total amount of at-risk subprime debt must exceed $2 trillion US Dollars. We believe this source of risk has been greatly underestimated in terms of risk to the Financial Sector over the next 12+ months (Source: zerohedge.com).
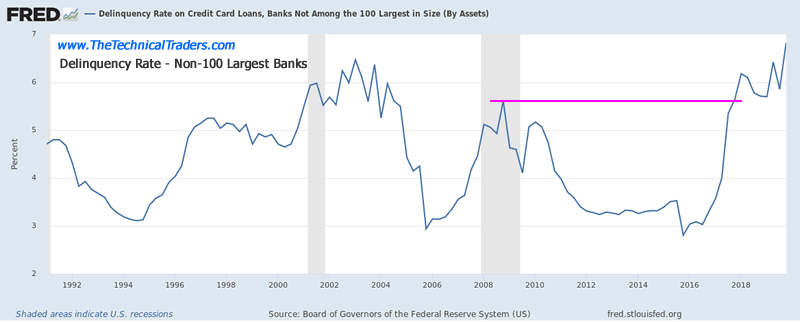
Non-100 Largest Banks Credit Card Delinquency Rates
The current delinquency rate among the non-100 largest US banks for credit cards has already climbed well above the 2008-2010 peak levels. It appears subprime borrowers are already pushed well beyond their limits in terms of servicing current debt levels. This suggests a contraction in the credit market will likely take place over the next 24+ months as these at-risk borrowers default at greater rates. This could transition into the housing market and other sectors of the economy if multiple waves of sub-prime borrowers stress the US financial system because of the COVID-19 shutdown.
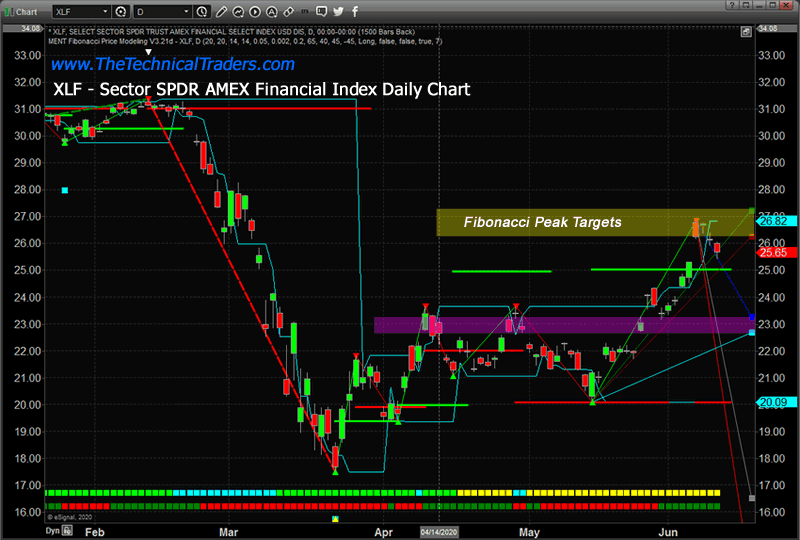
XLF FINANCIAL ETF INDEX DAILY CHART
Our research team believes the peak in the XLF ETF has already set up after the recent 47%+ rally from the March lows. The $27 price peak sets up directly between our two Fibonacci Daily upside price target (Peak) levels. We believe this setup is a very strong indication that a move to below $23 may be setting up over the next 30+ days. The Q2 data may very well push investors to re-evaluate the potential for the Financial sector if delinquencies and at-risk borrowers continue to default in greater numbers.
XLF FINANCIAL ETF INDEX WEEKLY CHART
This XLF Weekly chart highlights the recent rally and the “Gap” that recently filled. It is our belief that the range between the MAGENTA horizontal lines represents a very clear support/resistance level within this longer-term XLF chart. We believe that price will have to fall below $25 in order to initiate a deeper downside price move targeting recent low price levels or price will have to move above $27.50 in order to continue to rally. Currently, our researchers believe the downside potential has a much higher probability of success as we get closer to the end of Q2:2020.
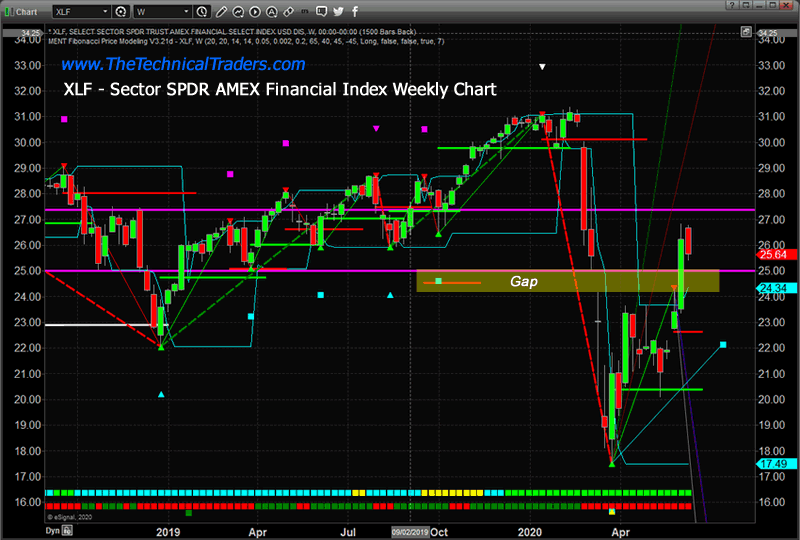
If our research is correct and XLF falls below the $25 price level, we believe it will target at least $22 to $22.50 before finding some support. If it breaks below the $22 price level, it could fall well below the $20 price level again on weaker expectations.
These types of price swings can be incredible setups for skilled technical traders. Follow our research and learn how we can help you find and execute better trades. We recently executed a new swing trade for our members that is already showing great opportunity. Protect your capital and learn to trade proven technical setups with our dedicated team of researchers and traders.
As a technical analyst and trader since 1997, I have been through a few bull/bear market cycles in stocks and commodities. I believe I have a good pulse on the market and timing key turning points for investing and short-term swing traders. 2020 is an incredible year for traders and investors. Don’t miss all the incredible trends and trade setups.
Subscribers of my Investor and Swing Trading Newsletters had our trading accounts close at a new high watermark. We not only exited the equities market as it started to roll over in February, but we profited from the sell-off in a very controlled way with TLT bonds for a 20% gain, and we closed out another winning trade last Friday.
Chris Vermeulen
www.TheTechnicalTraders.com
Chris Vermeulen has been involved in the markets since 1997 and is the founder of Technical Traders Ltd. He is an internationally recognized technical analyst, trader, and is the author of the book: 7 Steps to Win With Logic
Through years of research, trading and helping individual traders around the world. He learned that many traders have great trading ideas, but they lack one thing, they struggle to execute trades in a systematic way for consistent results. Chris helps educate traders with a three-hour video course that can change your trading results for the better.
His mission is to help his clients boost their trading performance while reducing market exposure and portfolio volatility.
He is a regular speaker on HoweStreet.com, and the FinancialSurvivorNetwork radio shows. Chris was also featured on the cover of AmalgaTrader Magazine, and contributes articles to several leading financial hubs like MarketOracle.co.uk
Disclaimer: Nothing in this report should be construed as a solicitation to buy or sell any securities mentioned. Technical Traders Ltd., its owners and the author of this report are not registered broker-dealers or financial advisors. Before investing in any securities, you should consult with your financial advisor and a registered broker-dealer. Never make an investment based solely on what you read in an online or printed report, including this report, especially if the investment involves a small, thinly-traded company that isn’t well known. Technical Traders Ltd. and the author of this report has been paid by Cardiff Energy Corp. In addition, the author owns shares of Cardiff Energy Corp. and would also benefit from volume and price appreciation of its stock. The information provided here within should not be construed as a financial analysis but rather as an advertisement. The author’s views and opinions regarding the companies featured in reports are his own views and are based on information that he has researched independently and has received, which the author assumes to be reliable. Technical Traders Ltd. and the author of this report do not guarantee the accuracy, completeness, or usefulness of any content of this report, nor its fitness for any particular purpose. Lastly, the author does not guarantee that any of the companies mentioned in the reports will perform as expected, and any comparisons made to other companies may not be valid or come into effect.
Chris Vermeulen Archive |
© 2005-2022 http://www.MarketOracle.co.uk - The Market Oracle is a FREE Daily Financial Markets Analysis & Forecasting online publication.