


US Dollar with Ney and Gann Angles
Currencies / US Dollar Jun 29, 2020 - 05:41 PM GMTBy: readtheticker

Where is price going, is there strength or weakness in the chart?
Previous Post on the US Dollar : Where is the US Dollar trend headed ?
The question is always what will the future price action look like ?
This post will highlight the use of lines generated by angles. Not trend lines, as trend lines require two known points on a chart, where as angles require only one known point and a angle degree to draw a line. The question then becomes how is the angle degree determined.
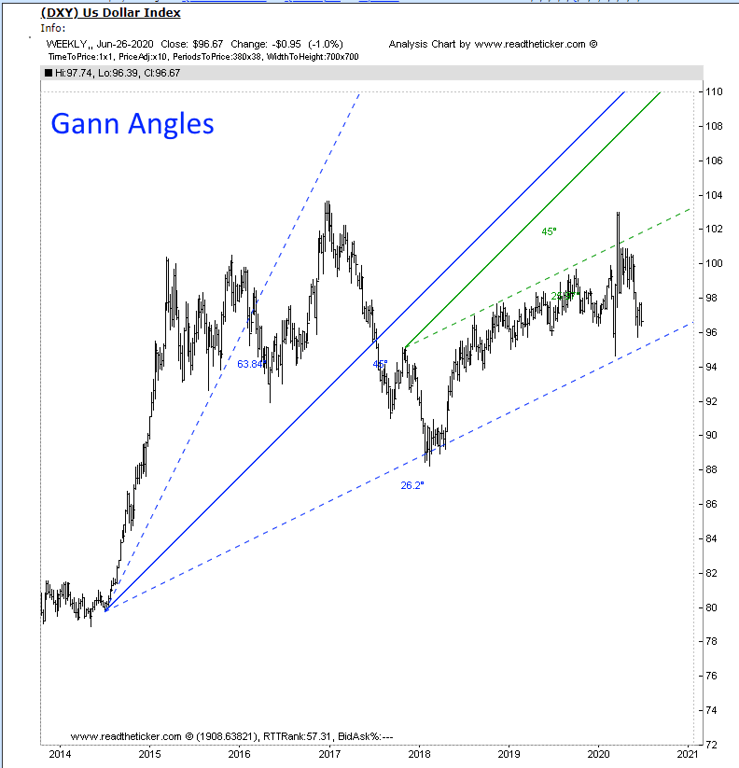
There are two theories: Gann Angles and Ney Angles. Gann angles are a fixed set of degrees (see below) and these degrees are based loosely on astrology and the regular cycle of planets around the sun. Gann said price would move between these angles as the angles acted as like critical support and resistance.
Gann Ratios to Degrees 8x1: 7.50°, 4x1: 15.00°, 2x1: 26.25°, 1x1: 45.00°, 1x2: 63.75° , 1x4: 75.00°, 1x8: 82.50°
These angles are a pre designed fixed set approach.
Gann Angle example on the US Dollar
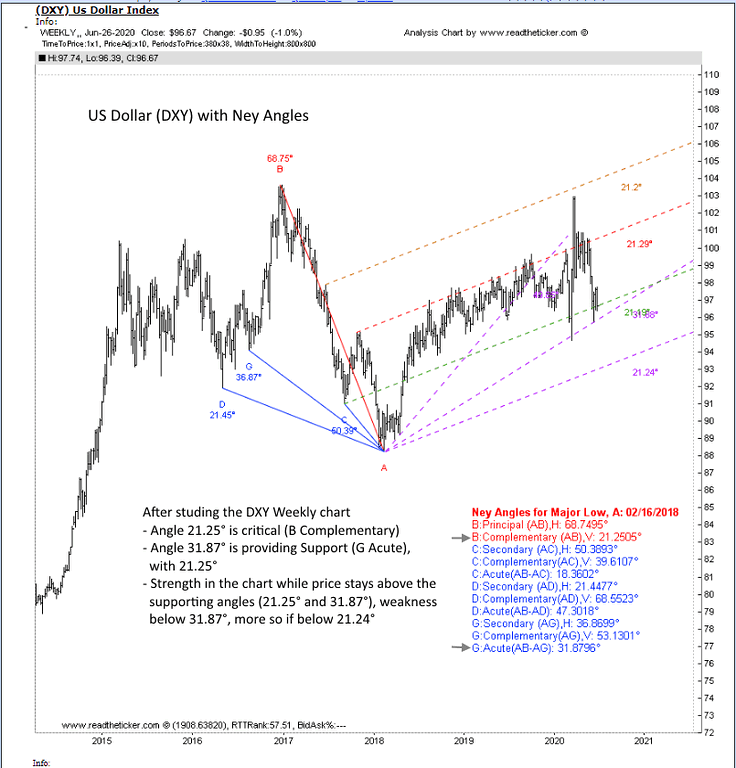
Ney angles are calculated from a major low, to preceding lows and major high. The idea is that the future pattern of price is related to the prior pattern of price. Price history does not always marry exactly to the future but it sure can rhyme. Richard Ney calculated the angles and then studied the chart to find which angles dominate price action.
These angles are a per low liquid set approach.
Ney Angle example on the US Dollar
Currently the US dollar chart has strength within it. Jeffer Snider gives a good reason.
Ref: Not COVID-19, Watch For The Second Wave of GFC2
If companies are in cost-cutting mode, and they obviously are, then that immediately puts a ceiling on the right side of the hoped-for “V” (arguing dead against the straight-line extrapolation) and then sets up the potential second wave of GFC2 and economic contraction. How? A weak labor market means instead of 90% of the 106 million work out their loan (or rent) situation before it goes too far, only 85% maybe even just 80% do! Heaven forbid something like 75%. Ninety percent would already be big trouble. Being unable to get close to everyone who has lost a job (or just lost income from wage or salary cuts plus those working less hours) back into their former groove is the real bogeyman lurking out there just over the visible time horizon. And that horizon is shrinking with every added missed payment due to a lost or shrunken paycheck. Less consumer spending means curtailed revenues, no pathway to restore profitability, and therefore even more, say it with me, cost cutting by businesses.
In short the FED can print money, but it can not print jobs and incomes. This matters as the US consumer is 70% of US GDP.
Fundamentals are important, and so is market timing, here at readtheticker.com we believe a combination of Gann Angles, Cycles, Wyckoff and Ney logic is the best way to secure better timing than most, after all these methods have been used successfully for 70+ years. To help you applying Richard Wyckoff and Richard Ney logic a wealth of knowledge is available via our RTT Plus membership. NOTE: readtheticker.com does allow users to load objects and text on charts, however some annotations are by a free third party image tool named Paint.net Investing
NOTE: readtheticker.com does allow users to load objects and text on charts, however some annotations are by a free third party image tool named Paint.net
Readtheticker
My website: www.readtheticker.com
We are financial market enthusiast using methods expressed by the Gann, Hurst and Wyckoff with a few of our own proprietary tools. Readtheticker.com provides online stock and index charts with commentary. We are not brokers, bankers, financial planners, hedge fund traders or investment advisors, we are private investors
© 2020 Copyright readtheticker - All Rights Reserved
Disclaimer: The material is presented for educational purposes only and may contain errors or omissions and are subject to change without notice. Readtheticker.com (or 'RTT') members and or associates are NOT responsible for any actions you may take on any comments, advice,annotations or advertisement presented in this content. This material is not presented to be a recommendation to buy or sell any financial instrument (including but not limited to stocks, forex, options, bonds or futures, on any exchange in the world) or as 'investment advice'. Readtheticker.com members may have a position in any company or security mentioned herein.
© 2005-2022 http://www.MarketOracle.co.uk - The Market Oracle is a FREE Daily Financial Markets Analysis & Forecasting online publication.