


Hyper-Chaotic Expectations Could Collapse US Economic Recovery Expectations
Economics / Coronavirus Depression Aug 16, 2020 - 07:22 PM GMTBy: Chris_Vermeulen

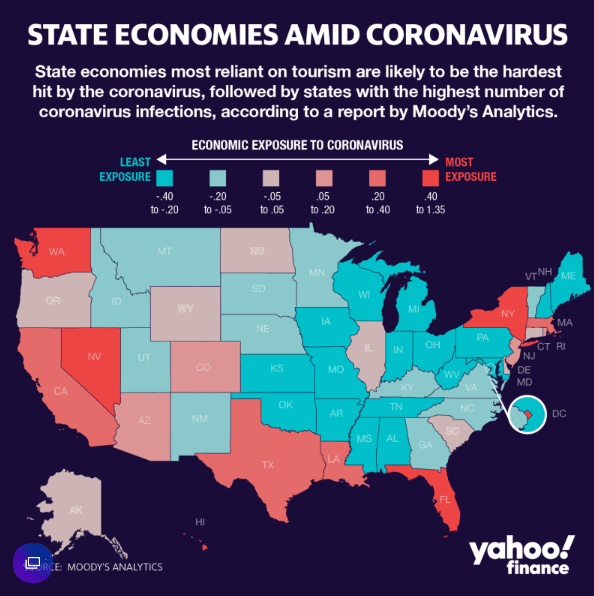
As much as we may not want to deal with the reality of the situation, recent news from the state of California suggests it and many other states may be reaching the fiscal boundaries of the COVID-19 economic contraction. The reality of the economic situation is that when consumers are restricted from normal activities, taxes, sales, and revenues decrease for the state exponentially. States that depend on consumers and business activity with very large budgets are at greater risk of experiencing immediate fiscal issues the longer the COVID-19 virus event continues. A recent Moody’s Analytics article suggested Nevada, Hawaii, New York, Washington, Florida, DC, and Connecticut would be hit the hardest by the COVID-19 virus.
STATE FINANCES A MESS
One has to use their imagination to attempt to understand the true scope of the issues ahead for states that experience what we are calling the “COVID Fiscal Cliff”. See the Yahoo! Finance graph below for a view of states that have the most economic exposure to COVID.
Expenses don’t stop that much for these states. They’ve made commitments many years into the future based on budgets and revenue expectations entrenched in the political works of each state. When a contraction of 10%, 20%, 30%, or more is experienced in revenues/income, it can be disastrous. The longer this type of revenue contraction exists, the more painful the Fiscal Death Thrashing for each state is likely to be.
Currently, the revenue levels appear to have decreased by approximately -30% from March 2020 to May 2020 according to a recent NPR article. As we can see from the chart below, the effect on each state varies state-by-state. Regardless, a -25% to -30% in revenues will crush many states’ future operations – almost immediately.
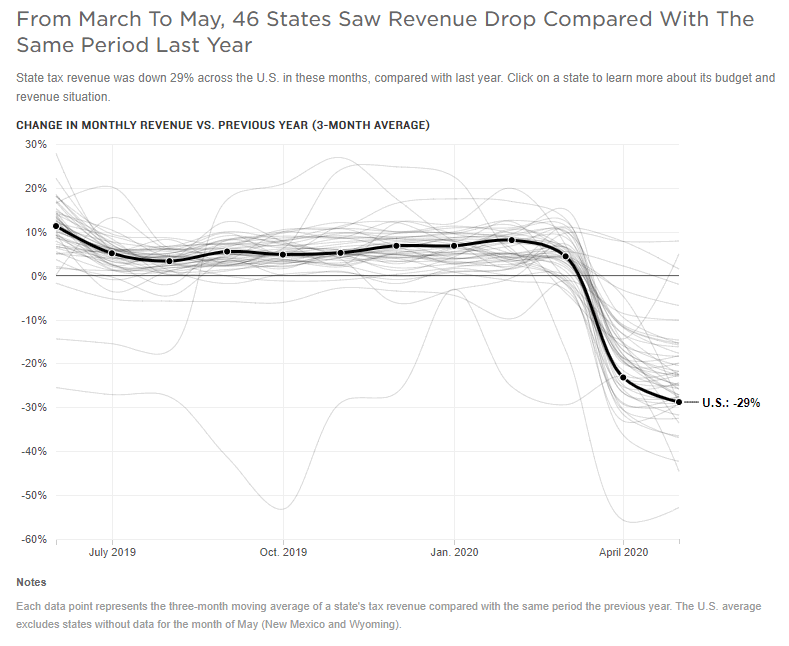
The article further states “Record-high unemployment has wreaked havoc on personal income taxes and sales taxes, two of the biggest sources of revenue for states. Hawaii’s and Nevada’s tourism industries have crashed, and states like Alaska, Oklahoma and Wyoming have been hit by the collapse of oil markets. From March through May of this year, 34 states experienced at least a 20% drop in revenue compared with the same period last year…”
When one looks at the US stock market reaching new all-time highs and expecting a continued “V-shaped” recovery, we believe the expectations many traders/investors have may be grossly inaccurate given state revenue data.
Before you continue, be sure to opt-in to our free-market trend signalsnow so you don’t miss our next special report!
CREDIT, DEBT & A LACK OF REAL INCOME
Consumers make up nearly 80% of the US total GDP. Certainly, a 20% to 30% decrease in consumer spending and activity will dent state and local city revenue sources. When we consider the huge wave of foreclosures, evictions, and job losses that are still pending to hit the economy, we are likely looking at tens of millions of US citizens being displaced or disqualified from consumer activity. This process will likely take 24+ months to fully materialize, yet we are only 5+ months into the process right now.
What happens to the support systems, housing, and how consumers engage in economic activity when states and cities have reached their limits and start cutting budgets and services? What happens to the stock market when investors suddenly realize the total scope of the true economic environment ahead? Will they be as aggressive in buying assets and stocks as they have been over the past 5+ months? One thing is certain, we have yet to identify and experience the total impact of the COVID-19 economic contraction yet – get ready for a “reality shock”.
I believe the Fibonacci Price Amplitude Arcs, shown below on this YM Monthly chart, are key to understanding how and where price risk may become excessive. Currently, price levels are trading just above the two GREEN Fibonacci Price Amplitude Arcs.
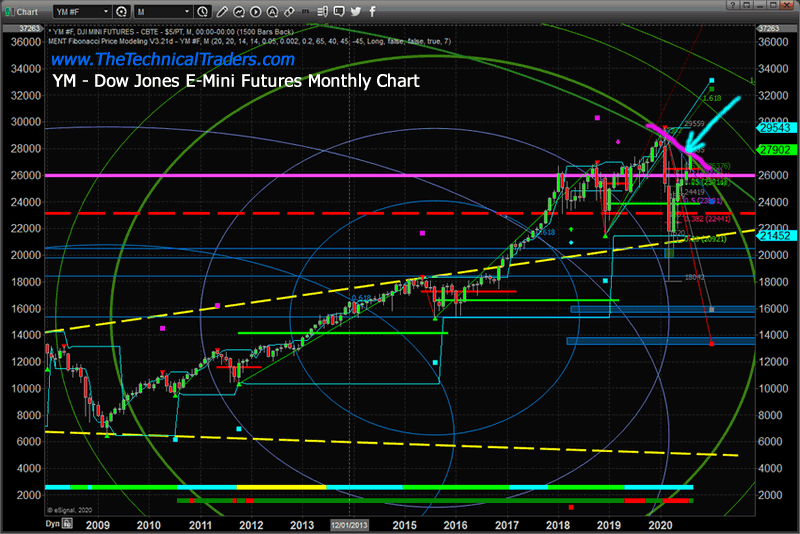
If the economy continues to recover at a moderate pace, then we may see further upside price activity from these levels. Yet, with only about 80 days to go before the US Presidential elections and with late Summer/Early Fall economic cycles in place, I believe the next phase of the economic contraction will come when consumers/cities/states start to become burdened with the lack of income and economic activity related to the COVID-19 virus event. We believe that process is starting to unfold right now.
States and cities that suddenly find themselves broke, or close to being broke, suddenly start acting differently – as we all do. We start to become more “protectionist” in our thinking. Whereas, prior to being broke, we could spend and enjoy different things. Now, being broke, means we can’t spend and enjoy – heck we may not even be able to pay for essential services or to keep the lights on.
A perfect example of the Economic Death Spiral event that often takes place when cities/states destroy their economic future is what is being reported in New York City. People with the means and ability are fleeing New York City “in droves” and the Mayor is pleading with these wealthy residents to “stay”. The only people that may eventually be left are those that don’t have the resources to leave.
These near all-time highs may seem like a very good opportunity for buying before the breakout, but we urge everyone to stay cautious because we believe a broader, longer-term cycle is taking place and we are just at the start of this potentially 24+ month cycle. Yes, the Fed can print lots of money and spread it around, but consumers and assets need to be engaged in real organic economic function for the economy to grow. If the Fed continues to attempt to buy up everything, this is not real organic growth – it is “life support”.
Pay attention to our research and please protect your assets and family. The process of global recovery after the COVID-19 virus is likely to take years. There will be very big and incredible opportunities for skilled technical traders over that time. Learn how we can help you trade and find success in these markets – sign up for my Active ETF Swing Trade Signals today!
If you have a buy-and-hold account (like retirement accounts) and are looking for technical signals for when to own equities, bonds, or cash, be sure to subscribe to my Passive Long-Term ETF Investing Signals, for which we expect to issue a new signal for subscribers soon. Stay healthy and rest easy at night by staying informed through our services – sign up today!
Chris Vermeulen
www.TheTechnicalTraders.com
Chris Vermeulen has been involved in the markets since 1997 and is the founder of Technical Traders Ltd. He is an internationally recognized technical analyst, trader, and is the author of the book: 7 Steps to Win With Logic
Through years of research, trading and helping individual traders around the world. He learned that many traders have great trading ideas, but they lack one thing, they struggle to execute trades in a systematic way for consistent results. Chris helps educate traders with a three-hour video course that can change your trading results for the better.
His mission is to help his clients boost their trading performance while reducing market exposure and portfolio volatility.
He is a regular speaker on HoweStreet.com, and the FinancialSurvivorNetwork radio shows. Chris was also featured on the cover of AmalgaTrader Magazine, and contributes articles to several leading financial hubs like MarketOracle.co.uk
Disclaimer: Nothing in this report should be construed as a solicitation to buy or sell any securities mentioned. Technical Traders Ltd., its owners and the author of this report are not registered broker-dealers or financial advisors. Before investing in any securities, you should consult with your financial advisor and a registered broker-dealer. Never make an investment based solely on what you read in an online or printed report, including this report, especially if the investment involves a small, thinly-traded company that isn’t well known. Technical Traders Ltd. and the author of this report has been paid by Cardiff Energy Corp. In addition, the author owns shares of Cardiff Energy Corp. and would also benefit from volume and price appreciation of its stock. The information provided here within should not be construed as a financial analysis but rather as an advertisement. The author’s views and opinions regarding the companies featured in reports are his own views and are based on information that he has researched independently and has received, which the author assumes to be reliable. Technical Traders Ltd. and the author of this report do not guarantee the accuracy, completeness, or usefulness of any content of this report, nor its fitness for any particular purpose. Lastly, the author does not guarantee that any of the companies mentioned in the reports will perform as expected, and any comparisons made to other companies may not be valid or come into effect.
Chris Vermeulen Archive |
© 2005-2022 http://www.MarketOracle.co.uk - The Market Oracle is a FREE Daily Financial Markets Analysis & Forecasting online publication.