


High-Flying COVID-19 Stocks Sectors May Be Setting Up For A Market Correction
Stock-Markets / Stock Markets 2020 Aug 27, 2020 - 10:20 AM GMTBy: Chris_Vermeulen

- KEY HIGHLIGHTS: COVID-19 has hit many retail and commercial sectors hard, but boosts Technology and Automobiles.
- The NASDAQ 100 Technology Sector Index suggests the 100% Measured Move is complete.
- NASDAQ BNCHMK Computer Hardware Index has reached a lofty 150% upside Measured Move expansion.
- US Automobiles Index currently nearing a 135% upside Measured Move.
- Will these trends continue, or are they a temporary “transitional process”?
As we’ve all been adjusting to the “work from home” transition that was forced upon us back in March/April 2020, a certain group of market sectors has really taken off and rallied into 100% and 100%+ Measured Moves. One thing I can personally associate with the home office transition the need to upgrade various components of my home office as the COVID-19 lock-down initiated. This has boosted the Technology sector. Another, less obvious, result of COVID revealed by our research showed what appears to be a mad dash to buy Automobiles.
COMPUTER HARDWARE AND TECHNOLOGY HAVE BEEN FLYING OUT THE DOORS
Our research team believes the transitional process of upgrading and setting up remote/home offices took place as consumers initially began to transition away from the Office. Initially, the $1,200 stimulus many received likely piled into technology and upgrades. Those of us who started to work from home needed to upgrade equipment and technology to address video conferencing and more. Many consumers also splurged on furniture, accessories, and other equipment to create our own “work-from-home paradise”. Corporations also increased their technology spend in this period to accommodate a fully remote workforce.
This new spending translated into a slew of online and in-person sales. One of our research team members recounted a story about visiting a local computer store shortly after the $1,200 stimulus checks arrived into the public’s hands and how the store owner stated: “we’ve seen a huge wave of $1,200 purchases over the past week or so – guess where those came from”. That same computer store last Thursday afternoon still had a line of people in front (understanding it is limiting the number of people into the store) and it didn’t appear that they were hurting for business.
Our research team believes the transitional process of setting up a new home office and/or doing upgrades to existing equipment has likely already peaked. If you are like most of us, you buy what you need and it works for you for 5+ years before you consider needing to upgrade again – maybe longer. This process, which likely started in April/May 2020, has already pushed sales of computer hardware, software, and other equipment to new highs. In fact, one of our favorite technical triggers, the “100% Measured Move” is clearly evident on some of the charts that follow.
This first chart is the Weekly NASDAQ 100 Technology Sector Index, which highlights a very clear 100% Measure Move to the upside after the bottom setup near March 21, 2020. The upside rally from early 2019 through February 2020 consisted of a +2518.44 point upside price rally (totaling +73.14%). The current upside price rally from the March 2020 lows consisted of a +2534.68 point upside price rally (totaling +64.89%). Even though the rally ranges are slightly different, this consists of a nearly perfect “100% Upside Measured Move”. Traditionally, price activity would stall at this point – attempting to establish a new price trend.
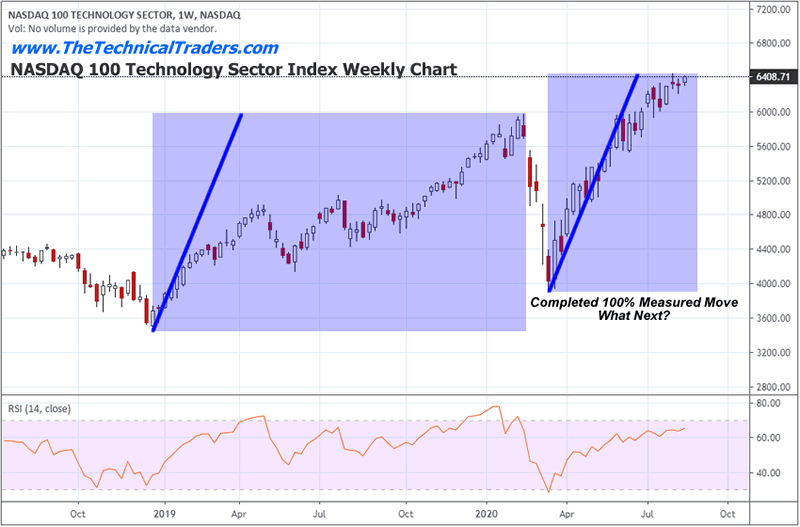
The 100% Measured Move technical pattern suggests that price often attempts to repeat a “price range” that has already been established by a previous trend. Sometimes, the Measured Move can extend beyond the 100% range (sometimes reaching Fibonacci expansion levels like 125%, 135%, 150%, or more). When those bigger Measured Moves take place, even larger and more volatile downside price corrections often follow a price peak.
In this case, the NASDAQ 100 Technology Sector Index suggests the 100% Measured Move is complete. Skilled traders should look to lighten existing long trades and prepare for a correction in the current price trend if and when the peak sets up.
Before you continue, be sure to opt-in to our free-market trend signalsnow so you don’t miss our next special report!t!
This next chart of the Weekly US BNCHMK Computer Hardware Index shows how a 150% Measure Move Expansion has taken place. Please notice how price corrected after reaching the 100% Measured Move total in early July. This is the type of “correction” we expect to see after the 100% Measured Move completes. The ability of this Index to push higher, above the 100% range, suggests traders and investors still believe in the ability for the rally to continue. We’ve discussed how we believe speculative traders have piled into certain sectors – almost like a dog chasing its tail. We believe this may be the case with recent activity in the Computer Hardware and the Technology sectors.
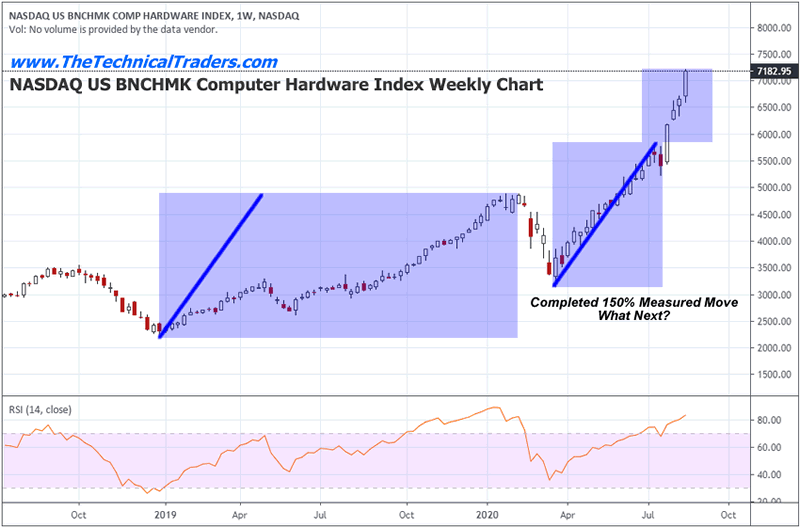
Our opinion is that once consumers have completed their upgrades and new purchases, it is very unlikely that they’ll continue to buy new equipment or computers every week or month. Generally, the equipment you purchase today will last for 5+ years.
Still, the message we want to clearly illustrate in this research article is that this NASDAQ BNCHMK Computer Hardware Index has reached a lofty 150% upside Measured Move expansion. This is often a very big upside price move which results in a moderately volatile price correction. Be prepared.
SURPRISE MOVE WITH US AUTOMOBILES INDEX
The one sector that really surprised us with a broad upside Measured Move expansion was Automobiles. It would appear many US consumers are taking advantage of the “perceived slowdown” in economic activity to upgrade their vehicles to newer models. Maybe it is a situation where consumers are not spending as much on travel back and forth to work or eating out and have suddenly found they can afford a newer (and increasingly electric) vehicle? Either way, it appears US consumers love their Automobiles and have become moderately active in purchasing newer models over the past 6 months.
The US Automobiles Index Weekly chart, below, shows a perfect 100% Upside Measured Move from the March 21, 2020 lows. Then, this chart shows a further expansion of the price rally which is currently nearing a 135% upside Measured Move. Pay very close attention to how the original 100% range expansion prompted a moderately deep price correction in early July.
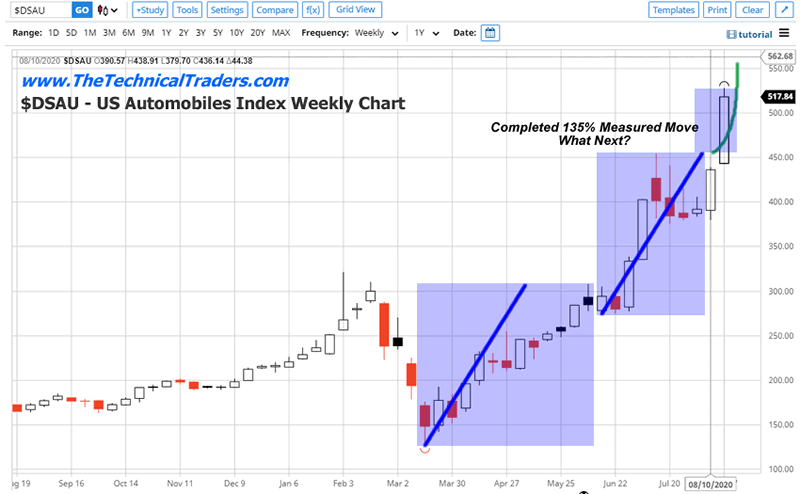
Will this boon in car sales continue? Again, you don’t go out and buy new cars every week or month. Once you commit to the new car purchase, that new car lasts you 5 to 10+ years (in most cases). So, we believe this transitional process of a “purchase frenzy” will likely abate over the next 6 to 12+ months as consumers settle into the Fall and Winter season and wait to see if a new COVID wave takes hold in the coming months. We believe those consumers who were able to take advantage of low rates or deep discounts on vehicles made the decision to upgrade simply because they found “extra cash” sitting around they would normally spend if there was not COVID-19 lock-down.
We wanted to illustrate how these high-flying sectors may become real opportunities for skilled traders/investors if the price corrections are deep enough to present real opportunities for a price recovery. Remember, once the US economy begins to establish real organic growth and wage growth again, the opportunity for various sectors of the US economy to begin to skyrocket is quite strong. The sectors we’ve highlighted today are sectors that have already benefited from the COVID-19 transition – where consumers spent on computer hardware and technology for their new home offices and on automobiles.
It is interesting to see how the lock-down would damage certain industries/sectors, while acting as rocket-fuel for others. The extra cash consumers saved by not going out and from their stimulus checks turned into big gains for Technology and Automobiles. Will these gains continue? We believe the transitional process may be nearing an end but may not have peaked yet. There may still be some upside left as long as consumers find money to spend.
Be sure to read the other research reports we issued recently, especially this week’s research on Gold & Silver Cycles and our Special Alert that points to a massive dual head-and-shoulders set up taking place this week.
Isn’t it time you learned how our research team can help you find and execute better trades? Our incredible technical analysis tools have just shown you what to expect 6+ months into the future. Do you want to learn how to profit from these moves? Visit www.TheTechnicalTraders.com to learn how we help thousands of traders every day take advantage of technical analysis and trade setups.
If you found this informative, then sign up now to get a pre-market video every day before the opening bell that walks you through the charts and my proprietary technical analysis of all of the major assets classes. You will also receive my easy-to-follow ETF swing trades that always include an entry price, a stop, two exit targets, as well as a recommended position sizing. Visit my Active ETF Trading Newsletter to learn more.
While many of you have trading accounts, our most important accounts are long-term buy-and-hold investment accounts. Our signals can help you preserve and even grow your long term capital. If you have any type of long-term investment or retirement account and are looking for signals as to when to own equities, bonds, or cash, be sure to become a member of my Long-Term Investing Signals, which includes a weekly market update and trade alerts.
Stay healthy and safe.
Chris Vermeulen
www.TheTechnicalTraders.com
Chris Vermeulen has been involved in the markets since 1997 and is the founder of Technical Traders Ltd. He is an internationally recognized technical analyst, trader, and is the author of the book: 7 Steps to Win With Logic
Through years of research, trading and helping individual traders around the world. He learned that many traders have great trading ideas, but they lack one thing, they struggle to execute trades in a systematic way for consistent results. Chris helps educate traders with a three-hour video course that can change your trading results for the better.
His mission is to help his clients boost their trading performance while reducing market exposure and portfolio volatility.
He is a regular speaker on HoweStreet.com, and the FinancialSurvivorNetwork radio shows. Chris was also featured on the cover of AmalgaTrader Magazine, and contributes articles to several leading financial hubs like MarketOracle.co.uk
Disclaimer: Nothing in this report should be construed as a solicitation to buy or sell any securities mentioned. Technical Traders Ltd., its owners and the author of this report are not registered broker-dealers or financial advisors. Before investing in any securities, you should consult with your financial advisor and a registered broker-dealer. Never make an investment based solely on what you read in an online or printed report, including this report, especially if the investment involves a small, thinly-traded company that isn’t well known. Technical Traders Ltd. and the author of this report has been paid by Cardiff Energy Corp. In addition, the author owns shares of Cardiff Energy Corp. and would also benefit from volume and price appreciation of its stock. The information provided here within should not be construed as a financial analysis but rather as an advertisement. The author’s views and opinions regarding the companies featured in reports are his own views and are based on information that he has researched independently and has received, which the author assumes to be reliable. Technical Traders Ltd. and the author of this report do not guarantee the accuracy, completeness, or usefulness of any content of this report, nor its fitness for any particular purpose. Lastly, the author does not guarantee that any of the companies mentioned in the reports will perform as expected, and any comparisons made to other companies may not be valid or come into effect.
Chris Vermeulen Archive |
© 2005-2022 http://www.MarketOracle.co.uk - The Market Oracle is a FREE Daily Financial Markets Analysis & Forecasting online publication.