


What Does this Valuable Gold Miners Indicator Say Now?
Commodities / Gold & Silver 2020 Sep 16, 2020 - 03:34 PM GMTBy: P_Radomski_CFA

Some swear by price action, many others rely on indicators. There are actually many gold trading tips built around these techniques. Gold Miners Bullish Percent Index, is one of the rare ones that don't issue signals all that often. And it showed the highest possible overbought reading recently.
The excessive bullishness was present at the 2016 top as well and it didn’t cause the situation to be any less bearish in reality. All markets periodically get ahead of themselves regardless of how bullish the long-term outlook really is. Then, they correct. If the upswing was significant, the correction is also quite often significant.
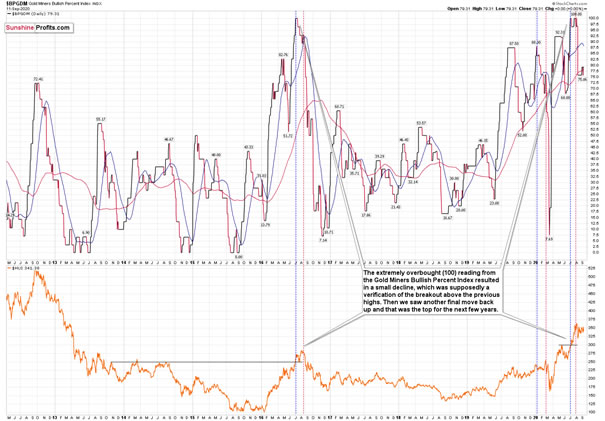
Please note that back in 2016, there was an additional quick upswing before the slide and this additional upswing has caused the Gold Miners Bullish Percent Index to move up once again for a few days. It then declined once again. We saw something similar also this time. In this case, this move up took the index once again to the 100 level, while in 2016 this wasn’t the case. But still, the similarity remains present.
Back in 2016, when we saw this phenomenon, it was already after the top, and right before the big decline. Given the situation in the USD Index, it seems that we’re seeing the same thing also this time.
Please note that back in 2016, after the top, the buying opportunity didn’t present itself until the Gold Miners Bullish Percent Index was below 10. It’s currently above 70, so it seems that miners have a long way to go before they bottom.
Three weeks ago, we commented on the above chart in the following way:
Now, since the general stock market moved above the previous highs and continues to rally, we might or might not see a sizable decline early this week. Back in March, the slide in miners corresponded to the decline in the general stock market, and this could be repeated, or we could see some sideways trading after the slide resumes, once stocks finally decline.
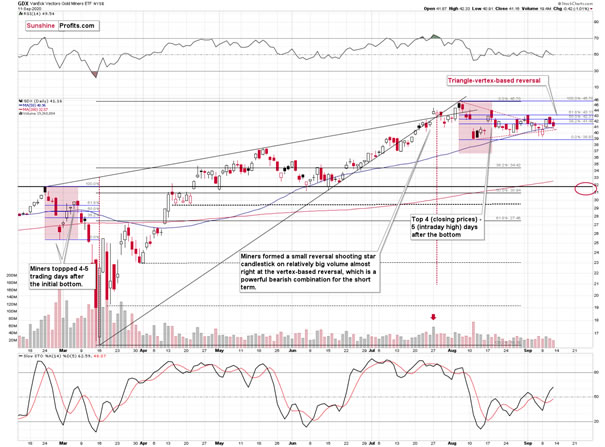
That’s exactly what happened. The general stock market continued to move higher, and mining stocks have been trading sideways instead of declining – or rallying. Before miners’ pause (and S&P’s breakout) miners were repeating their late-February and early-March performance. The implications of the self-similar pattern were bearish, and they continue to be bearish, only the timing changed.
The GDX ETF didn’t manage to break below the lower border of the triangle pattern yet, but given the situation in the USD Index and what we’re about to show in you case of gold, it’s likely that it will move lower shortly.
Based on the triangle (marked with red, dashed lines), we get a vertex. This means that it wouldn’t be surprising to see an intraday rally that is followed by a decline later today or tomorrow.
Also, let’s not forget that the GDX ETF has recently invalidated the breakout above the 61.8% Fibonacci retracement based on the 2011 – 2016 decline.
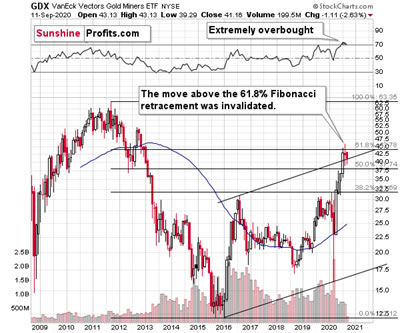
When GDX approached its 38.2% Fibonacci retracement, it declined sharply – it was right after the 2016 top. Are we seeing the 2020 top right now? This is quite possible – PMs are likely to decline after the sharp upswing, and since there are only several months left before the year ends, it might be the case that they move north of the recent highs only in 2021.
Either way, miners’ inability to move above the 61.8% Fibonacci retracement level and their invalidation of the tiny breakout is a bearish sign.
Everyone and their brother appear to be bullish on the precious metals sector right now, but if everyone is on the same side of the trade, it’s usually a good idea to be on the other side. There are quite a few factors pointing to lower precious metals prices on the horizon, and the situation in the mining stocks is one of them.
Thank you for reading today’s free analysis. Its full version includes detailed upside targets for our long positions in mining stocks that we entered in the last 25 minutes of Friday’s session (based on yesterday’s closing prices the UNLEVERAGED positions in GDX and GDXJ are about 50% profitable). We currently offer 10% discount for the first subscription period (even for the yearly subscriptions). Given how volatile the markets are, how profitable our trades just were and currently are, and how much is likely around the corner, the time to subscribe was never better – subscribe at a discount today.
Thank you.
Przemyslaw Radomski, CFA
Founder, Editor-in-chief
Tools for Effective Gold & Silver Investments - SunshineProfits.com
Tools für Effektives Gold- und Silber-Investment - SunshineProfits.DE
* * * * *
About Sunshine Profits
Sunshine Profits enables anyone to forecast market changes with a level of accuracy that was once only available to closed-door institutions. It provides free trial access to its best investment tools (including lists of best gold stocks and best silver stocks), proprietary gold & silver indicators, buy & sell signals, weekly newsletter, and more. Seeing is believing.
Disclaimer
All essays, research and information found above represent analyses and opinions of Przemyslaw Radomski, CFA and Sunshine Profits' associates only. As such, it may prove wrong and be a subject to change without notice. Opinions and analyses were based on data available to authors of respective essays at the time of writing. Although the information provided above is based on careful research and sources that are believed to be accurate, Przemyslaw Radomski, CFA and his associates do not guarantee the accuracy or thoroughness of the data or information reported. The opinions published above are neither an offer nor a recommendation to purchase or sell any securities. Mr. Radomski is not a Registered Securities Advisor. By reading Przemyslaw Radomski's, CFA reports you fully agree that he will not be held responsible or liable for any decisions you make regarding any information provided in these reports. Investing, trading and speculation in any financial markets may involve high risk of loss. Przemyslaw Radomski, CFA, Sunshine Profits' employees and affiliates as well as members of their families may have a short or long position in any securities, including those mentioned in any of the reports or essays, and may make additional purchases and/or sales of those securities without notice.
Przemyslaw Radomski Archive |
© 2005-2022 http://www.MarketOracle.co.uk - The Market Oracle is a FREE Daily Financial Markets Analysis & Forecasting online publication.