


Stock Market: Why You Should Prepare for a Jump in Volatility
Stock-Markets / Stock Markets 2020 Jan 24, 2021 - 02:54 PM GMTBy: EWI

This volatility indicator "has made a series of higher lows" -- and it's not a good sign
Stock market volatility is like a roller-coaster ride -- extreme ups and downs.
However, unlike thrill-seeking roller-coaster riders who often rise from their seats after the ride with a smile, investors often exit with a frown.
That's because extreme volatility after a stock rally often ends with prices much lower.
Having said that, many investors -- even professionals -- do not anticipate a jump in volatility right now.
Indeed, the San Diego Union-Tribune asked the senior principal of a financial advisory firm on Jan. 15:
Will 2021 be a volatile year for the stock market?
He replied:
NO: If 2020 had not been a volatile stock year -- what with the pandemic, recession, elections, and riots -- then it is reasonable to expect that 2021 should be relatively stable.
Yet, a key stock market indicator is revealing.
Here are insights from the Jan. 15 U.S. Short Term Update, a thrice weekly Elliott Wave International publication which provides near-term forecasts for major U.S. financial markets:
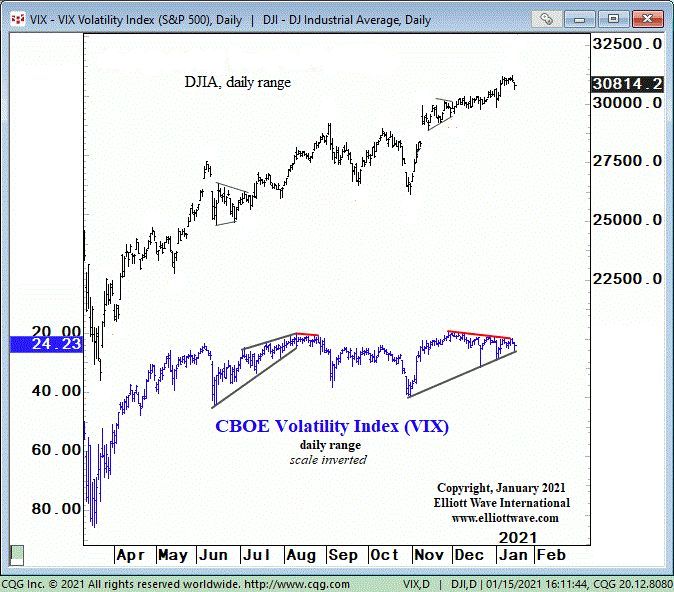
The chart shows the DJIA in the top graph and the CBOE Volatility Index (VIX) in the bottom graph. We've inverted the scale of the VIX so it aligns with stock prices. This index measures investors' expectations for market volatility for the coming 30 days. Most of the time, the VIX trends and reverses with stocks. When the behavior changes, it's time to watch both stocks and the VIX closely. The most recent intraday low in the VIX occurred at 19.51 on November 27. Since then, the DJIA has made a series of higher highs while the VIX has made a series of higher lows. This divergence is denoted with a red trendline on the chart.
The Jan. 15 U.S. Short Term Update goes on to describe a "clue" in spotting when volatility might start to spike.
Moreover, subscribers are provided with the Elliott wave labeling of the DJIA, which provides even more precision in ascertaining when to expect a change of character in the market.
Right now, you can read EWI’s U.S. market analysis FREE inside the State of the U.S. Markets FreePass event.
Now through February 3, you’ll see what Elliott waves show next for U.S. stocks, U.S. Treasuries, the U.S. dollar, gold and more
Follow the link to see everything that’s included and join now: State of the U.S. Markets FreePass.
This article was syndicated by Elliott Wave International and was originally published under the headline Stock Market: Why You Should Prepare for a Jump in Volatility. EWI is the world's largest market forecasting firm. Its staff of full-time analysts led by Chartered Market Technician Robert Prechter provides 24-hour-a-day market analysis to institutional and private investors around the world.
© 2005-2022 http://www.MarketOracle.co.uk - The Market Oracle is a FREE Daily Financial Markets Analysis & Forecasting online publication.