


Stock Market After The FOMC – What’s Next?
Stock-Markets / Stock Market 2021 Mar 22, 2021 - 12:32 PM GMTBy: Chris_Vermeulen

I have received numerous emails and questions regarding the market’s set up and what to expect after the Triple-Witching event (FOMC, Futures/Options expiration) last week. It appears many traders/investors are seeking some clarity related to price trends and the potential opportunities that are setting up in the US markets right now. In this research article, my research team and I provide some greater detail related to what we believe is likely to happen over the next 5 to 8+ weeks.
Our recent Gann/Fibonacci research article drew quite a bit of attention from readers. Their biggest concern was that we were suggesting a major peak in the markets could setup in early April 2021. We want to be clear about this longer term market setup to make sure our readers and followers fully understand the implications of this technical pattern.
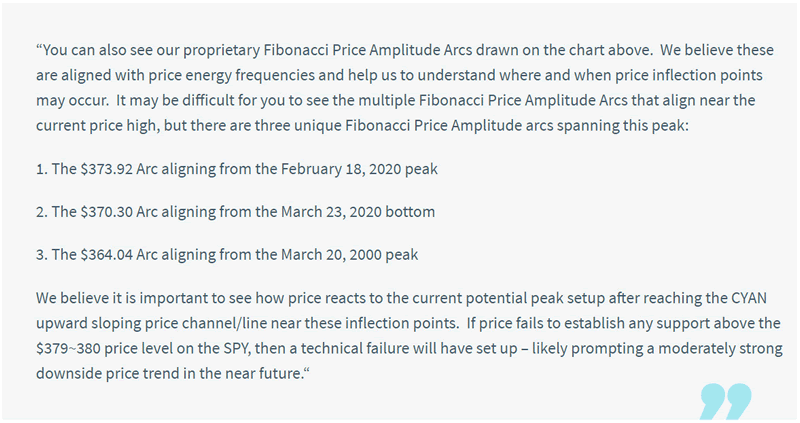
A peak/top could start to setup anytime after April 1, 2021, based on the Gann/Fibonacci research we’ve completed. But, that peak/top setup could also happen anytime between April 2021 and August 2021 (or slightly later). Timing this pattern is not something we can accomplish very easily as the range of dates where this Gann/Fibonacci inflection level exists consists of about 5+ months. The one key factor we continued to stress in that article was to “watch for a technical breakdown in price above the $379 to $380 price level on the SPY”. Many readers may be able to comprehend what we are trying to say by this statement, but we’ll try to help clarify it by showing what it would look like on a price chart.
Back in November 2020, we published a research article about how to spot an Excess Phase Top and the 5 unique phases that take place when this type of top executes. You can read this article here: www.thetechnicaltraders.com/how-to-spot-the-end-of-an-excess-phase-part-ii/. It is important to understand how capital continues to seek out opportunities within any market trend and how the current shift away from the NASDAQ and into the Dow Jones, Russell 2000 and other various sectors has started to shift the way the markets are reacting right now. We are seeing more weakness in the Technology and Internet sector now than we’ve seen in almost a decade. This could be setting up the first technical patterns of an Excess Phase Top already.
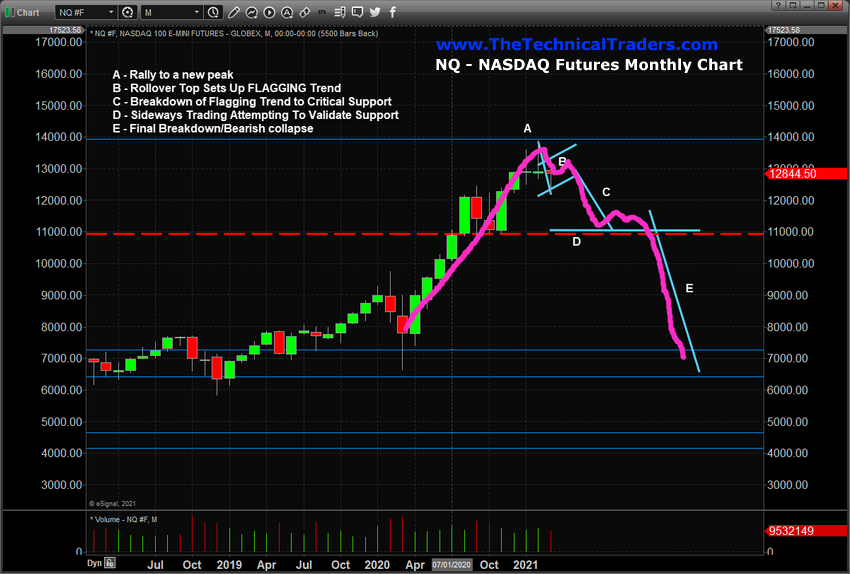
Monthly NQ Chart Shows Excess Phase Top May Already Have Started
The following Monthly NASDAQ chart highlights the five unique stages of an Excess Phase Peak and shows the recent weakness in the NASDAQ price trend may have already started the Phase B (Price Flagging) stage. Within this phase, price trends moderately higher for many weeks as weakness in the bullish price trend sets up a “rollover” type of peak. Obviously, the previous excess phase rally is stalling and traders are not yet fully aware of the risks that may continue to be present if this pattern persists. This Phase C (Breakdown of the Flagging pattern) would prompt a move to intermediate support, which will likely become the Critical support level in the NQ that may prompt the bigger Breakdown event(See the “D” setup).
So, what would price activity look like if our research is correct? How does this translate into opportunity for traders/investors right now and what should they look for in the future?
Expect Many Weeks of Flagging In The NQ
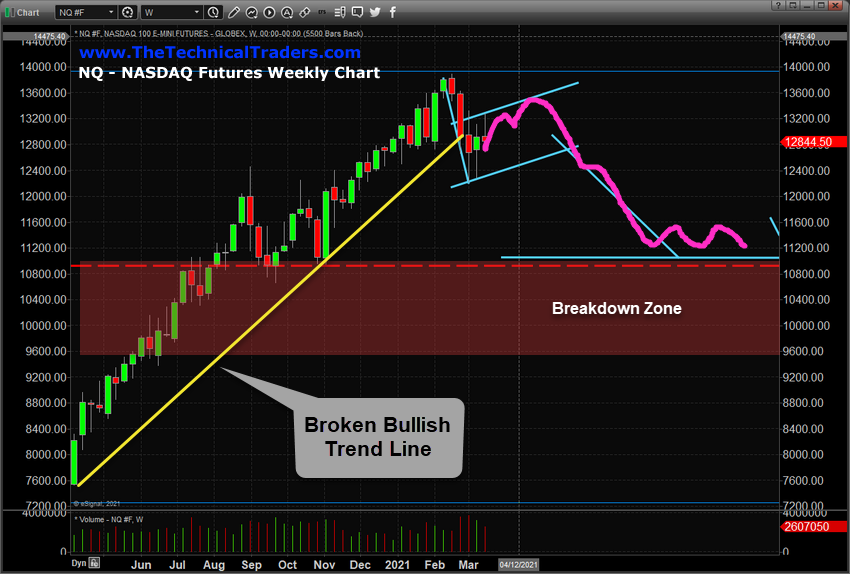
Let’s focus on the Weekly NQ Futures chart, below, and how the price has already set up into a potential sideways Bullish Flagging trend. The first thing we want you to focus on is the broken YELLOW bullish trend line. We would expect any continued sideways Flagging trend to trade within the CYAN price channels we’ve drawn on this chart. If this happens, we should continue to expect some moderate upside price trending throughout the sideways Flagging price channel before a bigger breakdown in price happens (as we’ve drawn in MAGENTA). This is why traders and investors need to fully understand the scope of our Gann/Fibonacci research article and to understand this setup may last into July/August of 2021 before finally entering a deeper downside price trend.
We profit from volatility by using non-directional options trading strategies so watch our webinar on How To Become An Options Strategy Master now!
If our research is correct, the sideways Flagging trend will prompt a moderate upside price trend for many weeks (possibly 4 to 8+) before a moderate breakdown event will see price levels fall -12% to -16% – targeting #D (the critical support level). At that point, the trend may firm up near support and begin a moderate upside price trend for many weeks or months; or we may see a technical price bounce near this level before a more immediate breakdown of price takes place. Either way, the Breakdown Zone is where we would consider a “technical price failure” to have confirmed – validating our Gann/Fibonacci peak prediction.
Currently, numerous sectors are generating new bullish trend triggers – many of which have already rallied 20 to 40% or more. As we suggested earlier, the shift in how capital is being deployed in the markets has prompted various sectors,many of which have been overlooked over the past 12+ months, to really begin to accelerate higher. This is because the froth near the peak in the NASDAQ, as well as the new geopolitical landscape, has prompted traders/investors to shift focus into new opportunities in sectors they believe have continued growth opportunities. For example, the Marijuana, Consumer Discretionary, Infrastructure and Real Estate sectors appear to be entering new bullish trends while the Technology, Healthcare, BioTech and Chip Manufacturers appear to be stalling.
What this means for traders/investors is that there is still lots of opportunity to trade the best opportunities in the markets. This is the focus of my BAN trading Strategy. Until we see a confirmed technical breakdown in the major markets, various sectors continue to present very strong opportunities for skilled technical traders.Don’t miss the opportunities to profit from the broad market sector rotations we expect this year, which will be an incredible year for traders of my Best Asset Now (BAN) strategy.
Learning to profit from these bigger trends and sector rotation will make a big difference between success and failure. We want to be clear, we are not calling for an April 1 peak in the markets based on our Gann/Fibonacci research. We are suggesting that a bigger “topping” pattern is already setting up in the markets and skilled technical traders should already be preparing for underlying risks related to this technical pattern. If you are not prepared for this, then please pay attention and learn from our research. You can sign up now for my FREE webinar that teaches you how to find, enter, and profit from only those sectors that have the most strength and momentum. Staying ahead of sector trends is going to be key to success in volatile markets.
In Part II of this research article, we’ll attempt to share more information about the Excess Phase Peak setup that may be setting up in the US markets and what to watch out for. Additionally, we’ll take a look at the Dow Jones Industrial chart to compare the NASDAQ setup to the INDU setup. Where we are seeing weakness in the NASDAQ right now, the Dow Jones Industrial chart appears to show a much stronger price trend right now.
Happy trading!
Chris Vermeulen
www.TheTechnicalTraders.com
Chris Vermeulen has been involved in the markets since 1997 and is the founder of Technical Traders Ltd. He is an internationally recognized technical analyst, trader, and is the author of the book: 7 Steps to Win With Logic
Through years of research, trading and helping individual traders around the world. He learned that many traders have great trading ideas, but they lack one thing, they struggle to execute trades in a systematic way for consistent results. Chris helps educate traders with a three-hour video course that can change your trading results for the better.
His mission is to help his clients boost their trading performance while reducing market exposure and portfolio volatility.
He is a regular speaker on HoweStreet.com, and the FinancialSurvivorNetwork radio shows. Chris was also featured on the cover of AmalgaTrader Magazine, and contributes articles to several leading financial hubs like MarketOracle.co.uk
Disclaimer: Nothing in this report should be construed as a solicitation to buy or sell any securities mentioned. Technical Traders Ltd., its owners and the author of this report are not registered broker-dealers or financial advisors. Before investing in any securities, you should consult with your financial advisor and a registered broker-dealer. Never make an investment based solely on what you read in an online or printed report, including this report, especially if the investment involves a small, thinly-traded company that isn’t well known. Technical Traders Ltd. and the author of this report has been paid by Cardiff Energy Corp. In addition, the author owns shares of Cardiff Energy Corp. and would also benefit from volume and price appreciation of its stock. The information provided here within should not be construed as a financial analysis but rather as an advertisement. The author’s views and opinions regarding the companies featured in reports are his own views and are based on information that he has researched independently and has received, which the author assumes to be reliable. Technical Traders Ltd. and the author of this report do not guarantee the accuracy, completeness, or usefulness of any content of this report, nor its fitness for any particular purpose. Lastly, the author does not guarantee that any of the companies mentioned in the reports will perform as expected, and any comparisons made to other companies may not be valid or come into effect.
Chris Vermeulen Archive |
© 2005-2022 http://www.MarketOracle.co.uk - The Market Oracle is a FREE Daily Financial Markets Analysis & Forecasting online publication.