


Gold Price Just Can’t Seem to Breakout
Commodities / Gold and Silver 2021 Apr 03, 2021 - 10:54 AM GMTBy: P_Radomski_CFA

Confirmed, unconfirmed, verified, and invalidated: breakouts and breakdowns are now ubiquitous. And the implications are bearish for gold.
Let’s start today’s analysis with a discussion of the key market that everyone is interested in – gold.
Gold’s Failed Breakout – A Sell Sign
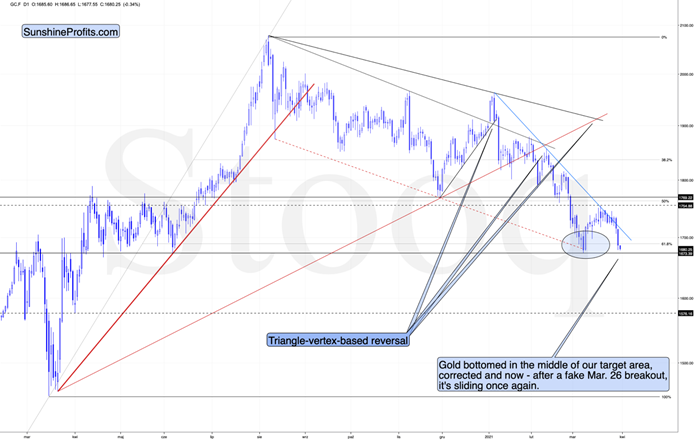
In short, gold just invalidated its small breakout above the declining blue resistance line. The previous breakout was small and thus it required a confirmation. It never got one, and instead gold plunged, invalidating the move. This is yet another sell sign that we saw.
It also serves as further proof that ever since the beginning of the year, gold permabulls (many people continue to claim that gold can only go up, even now) were destroying value rather than creating it. On a side note, we have nothing against checking out the work of other analysts, but we encourage you to check if someone was both bullish and bearish on a given market. If they never changed their mind, it seems that you can save some time by not reading what they come up with, as you already know the outcome. Besides it’s not like they would prepare you in advance for any decline (in case of permabulls).
Getting back to the current market situation – since gold moved lower quite visibly yesterday (Mar. 30), and even (almost) reached its early-March high, it might be tempting to think that the decline is over. This seems unlikely in my opinion.
The less important reason for the above is visible right on the above chart. Earlier this month, gold topped very close to its triangle-vertex-based reversal. The previous two triangle-vertex-based reversals also triggered declines. So, if something similar triggered similar moves, then it might be worth checking how big did the previous declines end up being.
Both previous 2021 declines were followed by quite visible declines. The one that started in early Jan. took gold over $130 lower, and the one that started in mid-Feb. took gold over $170 lower. The current decline started at $1,754.20, so if the history is to rhyme (as it often does), gold would be likely to decline to at least $1,584 - $1,624. This target area corresponds quite well to the support provided by the early Mar. and early Apr. 2020 lows.
The more important reasons due to which it seems likely that the decline will continue are: the rally in the USD Index and the rally in the long-term interest rates.
The USD’s Rally
As far as the latter is concerned, it seems unlikely that we’ll see the Fed stepping into action with another Operation Twist until the general stock market slides. Otherwise, such a big intervention might seem uncalled for. Consequently, the long-term rates are likely to rally some more. And gold is likely to respond by declining further.
As far as the USD Index in concerned, it just moved to new yearly highs, and since the nearest strong resistance is relatively far (from the short-term point of view), it seems that the move higher will continue with only small corrections along the way.
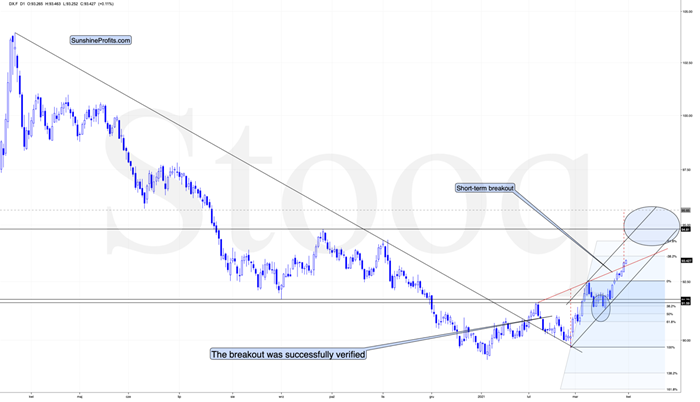
The USD Index has not only confirmed the breakout above its Feb. highs, but it even managed to break above the rising red support line. This line, along with the rising black line based on the Feb. and mid-March lows, creates a rising wedge pattern that was already broken to the upside. The moves that tend to follow such breakouts often are as big as the size of the wedge. I used red, dashed lines for this target-determining technique. Based on it, the USD Index is likely to rally to about 96.65.
The above target is slightly above the mid-2020 highs, so it might seem more conservative to set the upside target at those highs, close to the 94.5-94.8 area. The mid-2020 highs are likely to trigger a breather, but it doesn’t have to be the case that the USD Index pauses below these highs. Conversely, it could be the case that the USD Index first breaks above the mid-2020 highs and consolidates after the breakout. In fact, that’s what it did with regard to the breakout above the Feb. 2021 highs.
Consequently, I’m broadening the target area for the USD Index, so that it now encompasses also the more bullish scenario in which the USDX takes out the mid-2020 highs before consolidating.
Either way, we’re currently in the “easy part” of the USD’s rally. Even if it’s going to consolidate at or below the mid-2020 highs, it’s still very likely to first get there, and this implies a move higher by at least another full index point. This means that the gold price is likely to decline some more before finding short-term support. The scenario fits very well with the situation that I outlined based on the gold chart earlier today.
Silver Losses
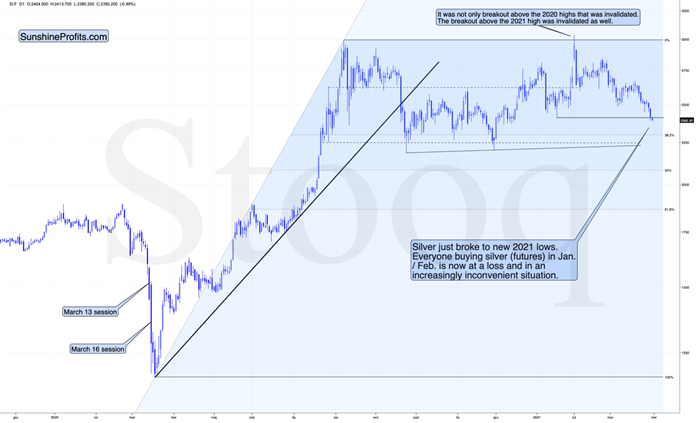
Silver just broke to new 2021 lows. Everyone buying silver (futures) in Jan. / Feb. is now at a loss and in an increasingly inconvenient situation.
Why would this be important? Because it means that everyone who jumped into the silver market with both feet based on just very brief research (“research”?) which in many cases was following instructions provided at various forums is in a losing position right now.
Sometimes the losses are small – for the very few, who were early, but in some cases, the losses are already quite visible – especially for those, who bought close to $30.
Why is this important? Because it emphasizes the need to verify the quality of the information that one chooses to act on, and because it’s a tipping point after which the previous buyers are likely to start becoming sellers, thus adding to decline’s sharpness.
The “new silver buyers” losses are not huge yet, but after another move lower, they will likely become such and the sales from those buyers would likely make these declines even bigger.
When everyone and their brother was particularly bullish on silver a few months ago, I wrote that they might be quite right, but the timing was terrible. So far, the losses for those, who bought silver earlier this year are not that big, but, in my opinion, they are likely to become much bigger in the following weeks.
Of course, I expect silver price to soarin the following years (well over $100), but not without plunging first in the short and/or medium term.
The Miners’ Relative Strength
Let’s take a look at the mining stocks. In yesterday’s analysis , I explained the likely reason behind the temporary strength in the mining stocks, and I emphasized that it’s not likely to last. This explanation remains up-to-date:
Ultimately, it’s never possible to reply to the “why did a given market move” other than that “because buyers won over sellers”. It’s not particularly informative, though. The reason that seems most likely to me is that it was… a purely technical development that “needed” to happen for a formation to be complete.
This hypothesis would explain also one odd thing that happened yesterday. Namely, while the GDX closed the day slightly higher, the GDXJ ended the day lower. This would make sense if the general stock market declined ( junior mining stocks – GDXJ tend to follow its lead more than seniors – GDX) – but the point is that the general stock market ended yesterday’s session basically flat (declining by mere 0.09% decline).
“Ok, so what kind of formation are miners completing?”
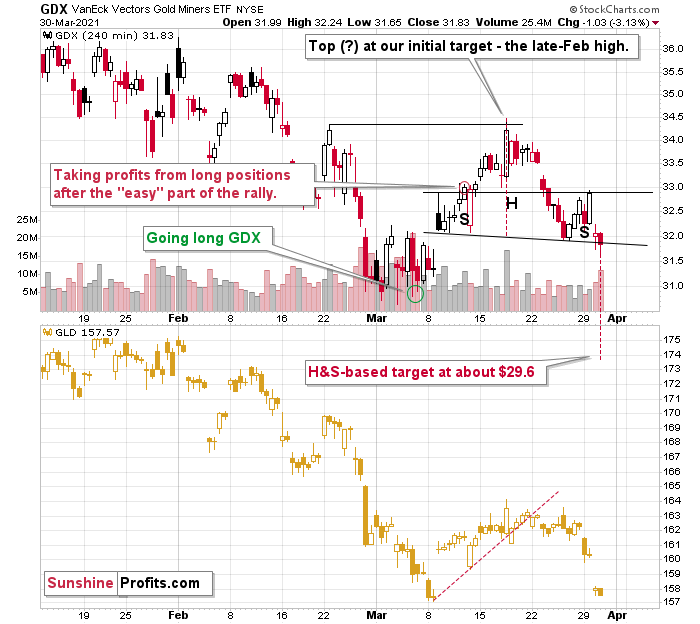
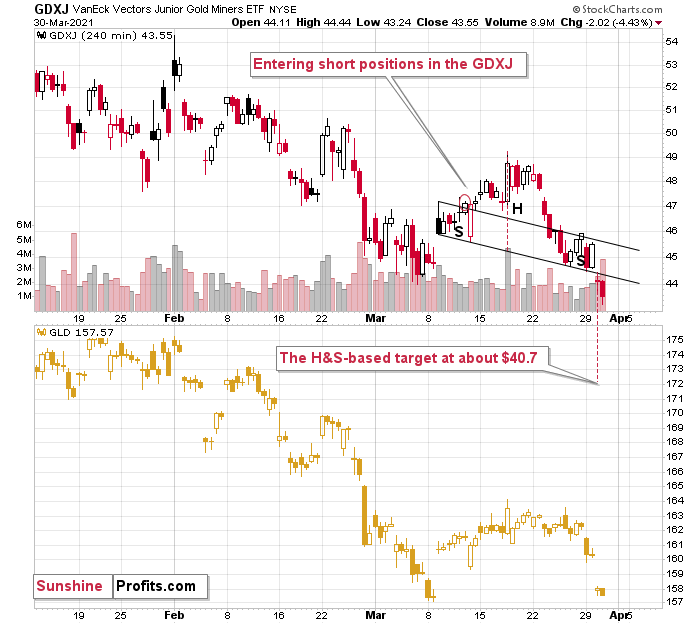
Quite likely the head and shoulders formations. The reason for yesterday’s underperformance of the GDXJ would be the fact that in case of this ETF’s head-and-shoulders formation , the neckline is descending much more visibly. These formations are more visible on the 4-hour charts – so, let’s zoom in.
Currently – based on yesterday’s (Mar. 30) closing prices – both formations are completed, and while it could still be the case that both ETFs move back to their previous necklines to verify the breakdowns, the implications are already bearish for the short term.
The price targets based on those formations are $29.6 and $40.7 for the GDX and GDXJ, respectively. However, let’s keep in mind that the H&S-based targets should be viewed as “minimum” targets, not necessarily the final ones.
All in all, the technical picture currently favors lower precious metals (and mining stock) prices over the next several weeks. In my view, this is either the middle or the final part of the very final decline in the precious metals market, before it takes off based on multiple positive factors of long-term nature.
Thank you for reading the above free analysis. It’s part of today’s extensive Gold & Silver Trading Alert. We encourage you to sign up for our free gold newsletter – as soon as you do, you'll get 7 days of free access to our premium daily Gold & Silver Trading Alerts and you can read the full version of the above analysis right away. Sign up for our free gold newsletter today!
Thank you.
Przemyslaw Radomski, CFA
Founder, Editor-in-chief
Tools for Effective Gold & Silver Investments - SunshineProfits.com
Tools für Effektives Gold- und Silber-Investment - SunshineProfits.DE
* * * * *
About Sunshine Profits
Sunshine Profits enables anyone to forecast market changes with a level of accuracy that was once only available to closed-door institutions. It provides free trial access to its best investment tools (including lists of best gold stocks and best silver stocks), proprietary gold & silver indicators, buy & sell signals, weekly newsletter, and more. Seeing is believing.
Disclaimer
All essays, research and information found above represent analyses and opinions of Przemyslaw Radomski, CFA and Sunshine Profits' associates only. As such, it may prove wrong and be a subject to change without notice. Opinions and analyses were based on data available to authors of respective essays at the time of writing. Although the information provided above is based on careful research and sources that are believed to be accurate, Przemyslaw Radomski, CFA and his associates do not guarantee the accuracy or thoroughness of the data or information reported. The opinions published above are neither an offer nor a recommendation to purchase or sell any securities. Mr. Radomski is not a Registered Securities Advisor. By reading Przemyslaw Radomski's, CFA reports you fully agree that he will not be held responsible or liable for any decisions you make regarding any information provided in these reports. Investing, trading and speculation in any financial markets may involve high risk of loss. Przemyslaw Radomski, CFA, Sunshine Profits' employees and affiliates as well as members of their families may have a short or long position in any securities, including those mentioned in any of the reports or essays, and may make additional purchases and/or sales of those securities without notice.
Przemyslaw Radomski Archive |
© 2005-2022 http://www.MarketOracle.co.uk - The Market Oracle is a FREE Daily Financial Markets Analysis & Forecasting online publication.