


AI Tech Stocks Buying Levels, Expensive / Cheap (EC) Indicator and Buy % Ratings Review
Companies / Tech Stocks May 20, 2021 - 05:10 PM GMTBy: Nadeem_Walayat

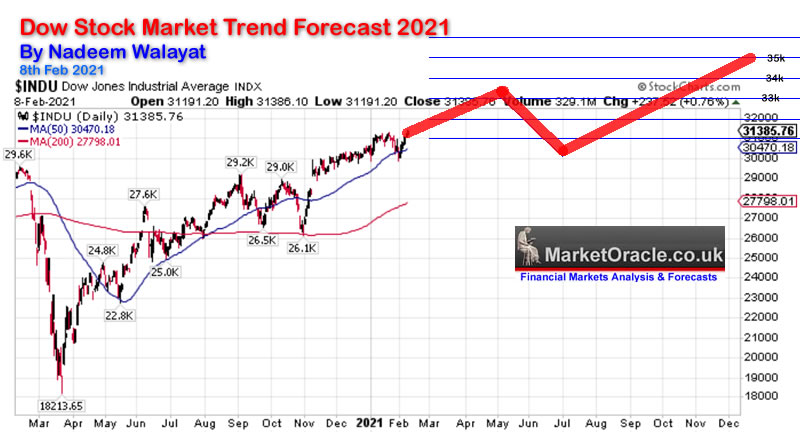
The stock market is now moving into my forecast time window for a correction to begin of approx 10% decline as illustrated by my trend forecast graph -
9th Feb 2021 Dow Stock Market Trend Forecast 2021
(Charts courtesy of stockcharts.com)
Current price action has the Dow breaking to a New all time high of 34,548, running the short stops (including mine) built up during the past 2 weeks of consolidation near the last high. So where the Dow is concerned right now the start of the correction remains pending.
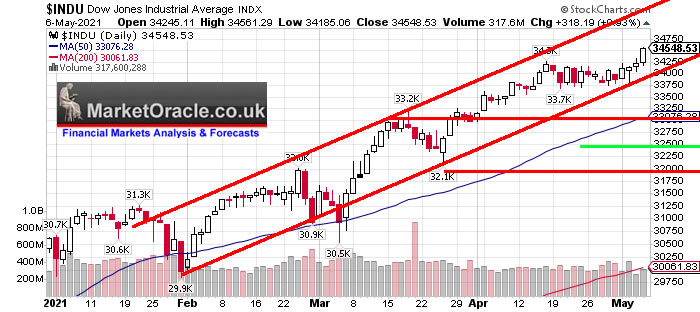
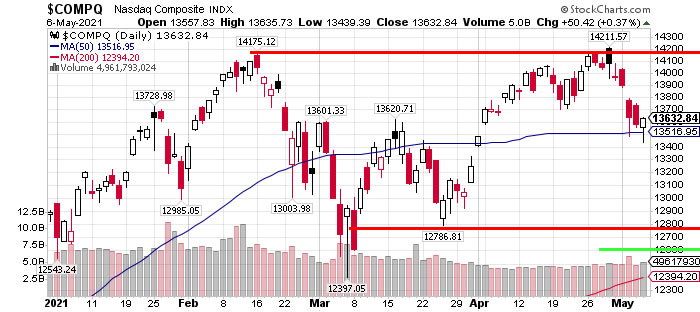
However, the correction in tech stocks that we want to see correct has already begun! So it is possible we may see continuing divergence to some degree between the general stock market indices and the tech sector, with likely the pseudo analysts that populate the media will refer to it as sector rotation, when instead it is a a case of many tech stocks such as Tesla being bid up to trade on ridiculous valuations. Whilst the post covid Fed induced economic boom is lifting the downtrodden stocks sectors of 2020 higher, hence the divergence.
So lets see if the ongoing sell off in tech stocks can resolve in buying opportunities in AI stocks.
Firstly What are Buying Levels?
Buying levels are high probability technical levels that a stock 'could' trade down to during a correction i.e. an achievable technical chart level that could be used to for instance to put in buy limit orders at just above the buying level if one is eager to accumulate more stock into any particular company as an example last September the Buying Level for Google (Alphabet) was $1395, so a limit order at $1395 or higher would be the objective depending on how eager one is to gain exposure to Google i.e. If I really wanted to buy more Google at the time then the limit order would be OVER $1400 as stocks tend to find support at round numbers, whilst if I was less inclined to buy Google then the Buying level would be at $1395, lower than that and there is a decreasing probability that a buy will be triggered.
Stocks Expensive or Cheap Indicator (EC)
This basically condenses down some 12 financial indicators I track for most stocks to determine if they are expensive or cheap (EC), as stock prices are usually not a good indicator of value.
At it's most basic the higher the number the more expensive a stock is and conversely the lower the number the cheaper a stock is. Where a reading of 20-60 tends to be the sweet spot for most AI stocks as it implies earnings growth coupled with sustainable speculative interest and thus results in good trending charts with support during corrections, where value tends to be fair so as to enable one to accumulate stock.
Whilst readings above 60 increasingly indicate high levels of speculative interest in future earnings growth. However, this does not automatically mean that a stock trading over 60 should not be bought or sold, it just means that there is a lot of speculative interest in that stock so expect greater price volatility as investors are more likely to react to news events. So I would still invest in a stocks trading over 60 if they have a good reason to justify such speculative interest i.e. such as AMD and Nvidia as being higher risk stocks. Or Amazon of a say 6 months ago that was set to greatly profit from covid-19 lockdown's.
Over 100 is where stocks are becoming a bit to hot to handle where holding let alone buying depends on understanding what's in the pipeline, what it is driving the stocks into the stratospheric valuations such as AMD first killing Intel and now giving Nvidia a run for it's money. Whilst there will be some such as Amazon, I can't quite fathom the high valuation hence reduce my exposure to.
Whilst readings Under 20 suggests little speculative interest to drive stock prices significantly higher, so likely to expect trading ranges and thus tend to be sleeping giants in the AI mega-trend. Also could be signaling problems with the stocks i.e. such as Intel losing the CPU war to AMD which has has made Intel a disliked stock to hold whilst AMD has been heavily bid up into fever making it an expensive buy.
Buy % Rating
The the Buy percent indictor is how good of a buy a stock is right now which is based on valuations and short-term stock trends. So 100% means a VERY GOOD BUY, whilst 0% means a bad buy with 50% neutral. Note this is in terms of BUYING and NOT SELLING! So understand 0% is NOT a SELL rating, it just means that it's a good time to buy a particular stock in terms of price trend and valuation right now at the time of analysis.
AI Stock Buy % Rating Review
Here's a quick review of my last update of 28th Feb 2021 that incorporated the new short-term Buy % indicator.
AI Tech Stocks Buying Ratings, Levels and Valuations March 2021
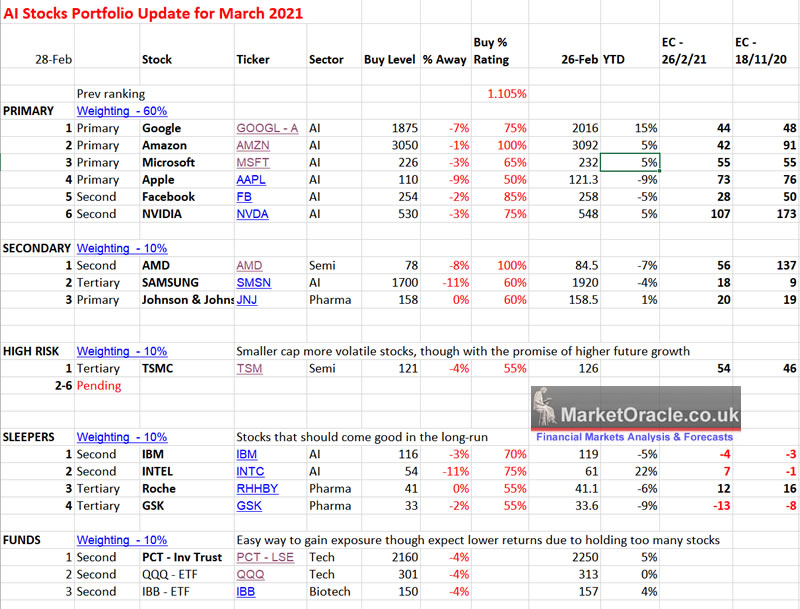
So how did the buy % rating perform compared to what has subsequently transpired ?
100% Amazon $3312 vs $3092 +7.5%
100% AMD $78.8 vs $78 +1%
85% Facebook $319.8 vs $254 +26%
75% Google $2398 vs $2016 +19%
75% Intel $57.5 vs $61 - 5.5%
75% NVIDIA $592 vs $548 +8%
70% IBM $145.5 vs $119 +22%
65% Microsoft $252.5 vs $226 +11.7%
Overall the Buy % proved useful in identifying stocks that had a high probability for trending higher and thus to not risk waiting for lower prices before buying.
TOP AI Mega-trend Stocks Analysis
the rest of this extensive analysis that concludes in buying levels for AI tech stocks. AI Stock Buying Levels, Ratings, Valuations and Trend Analysis into Market Correction has first been made available to Patrons who support my work.
Contents:
- TESLA
- Cathy Wood ARK Funds CRASH!
- India Apocalypse Heralds Catastrophe for Pakistan and Bangladesh
- Covid-19 in Italy in August 2019!
- Stock Market Early Summer Correction Trend Forecast
- Stocks Expensive or Cheap Indicator (EC)
- AI Stock Buy % Rating Review
- 1. GOOGLE - $2398
- 2. AMAZON - $3312
- 3. MICROSOFT - $252.5
- 4. APPLE - $130
- 5. FACEBOOK - $320
- 6. NVIDIA - $592.5
- 7. AMD - $78.8
- 11. IBM - $145.5
- 12. INTEL - $57.7
- AI Stocks Buying Levels Update May 2021
- So what am I going to do
- GPU Mining FREE MONEY!
- CHIA Crypto Farming with Your Hard Drives Insanity!
So for immediate first access to ALL of my analysis and trend forecasts then do consider becoming a Patron by supporting my work for just $3 per month. https://www.patreon.com/Nadeem_Walayat.
My analysis schedule includes:
- More High Risk Tech Stocks - 30% done
- Bitcoin Trend Forecast - 40% done
- UK House Prices Trend Analysis - 10% done
- How to Get Rich! - 70% done
- US Dollar and British Pound analysis
- Gold and SIlver Price Analysis
And ensure you are subscribed to my ALWAYS FREE newsletter for my next in-depth analysis.
Your analyst locked an loaded for the next AI stocks discount sale that should soon start to materialise as per my forecast of 11th Feb..
Nadeem Walayat
Copyright © 2005-2021 Marketoracle.co.uk (Market Oracle Ltd). All rights reserved.
Nadeem Walayat has over 30 years experience of trading derivatives, portfolio management and analysing the financial markets, including one of few who both anticipated and Beat the 1987 Crash. Nadeem's forward looking analysis focuses on UK inflation, economy, interest rates and housing market. He is the author of five ebook's in the The Inflation Mega-Trend and Stocks Stealth Bull Market series that can be downloaded for Free.


 Nadeem is the Editor of The Market Oracle, a FREE Daily Financial Markets Analysis & Forecasting online publication that presents in-depth analysis from over 1000 experienced analysts on a range of views of the probable direction of the financial markets, thus enabling our readers to arrive at an informed opinion on future market direction. http://www.marketoracle.co.uk
Disclaimer: The above is a matter of opinion provided for general information purposes only and is not intended as investment advice. Information and analysis above are derived from sources and utilising methods believed to be reliable, but we cannot accept responsibility for any trading losses you may incur as a result of this analysis. Individuals should consult with their personal financial advisors before engaging in any trading activities.
Nadeem Walayat Archive |
© 2005-2022 http://www.MarketOracle.co.uk - The Market Oracle is a FREE Daily Financial Markets Analysis & Forecasting online publication.