


DXY Weakness: Are You in A Crowded Commodities Trade?
Currencies / US Dollar May 22, 2021 - 09:55 AM GMTBy: Submissions

Have you been long commodities like agriculture or oil? The US Dollar has continued to weaken, but is this trade getting a little long in the tooth?
Happy Hump Day, folks. Here are some quick facts: The US dollar has been in a steep downtrend since late March. The most recent CPI print in the US was a monster. The Fed has continued with the “lower for longer” theme. The Biden administration is looking to spend trillions upon trillions with no clear path for repayment, and it doesn’t seem to matter. Has the short dollar/long commodities trade gotten “too easy"?
The answer is yes, or at least most likely. Some steam will have to come out at some point. I’m not setting off any immediate alarm bells here and don't care to theorize on whether inflation is indeed transitory, as the Fed states. However, when a trade theme has that much going for it, for so long, in leveraged markets, it usually ends suddenly or at least experiences a snapback. Just some food for thought.
The US Dollar Index (DXY) can give us some clues.
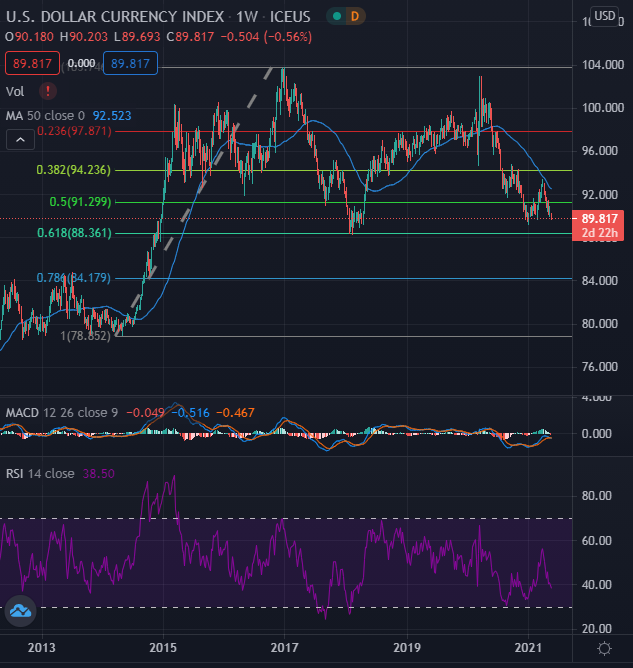
Figure 1 - US Dollar Currency Index Weekly Candles April 2012 - May 18, 2021. Source tradingview.com
In the above long-term US Dollar Index chart (DXY, weekly candles), we can see the long-term picture beginning back in April of 2012. We can see the long-term Fibonacci levels by starting near the lows in 2014 near the 78 - 79 handles, and using the high levels in December 2016 when it traded north of 103.50. We can see that some major support was found in Q1 2018 right at the 61.8% retracement level near 88.36. This area is a long-term level, folks, and it held up very well on its last attempt. The DXY did trade in a range near this level for several months before bouncing and turning upward. Could we be in for a similar setup shortly? Since we are so close to this key level, I believe this is worth a mention and some thought.
Digging deeper, to get a broader look at commodities, we turn to the S&P Goldman Sachs Commodity Index (SPGSCI). You could also look at the Invesco DB Commodity Index Tracking Fund (DBC), which is very liquid, but let's look at the SPGGSCI.
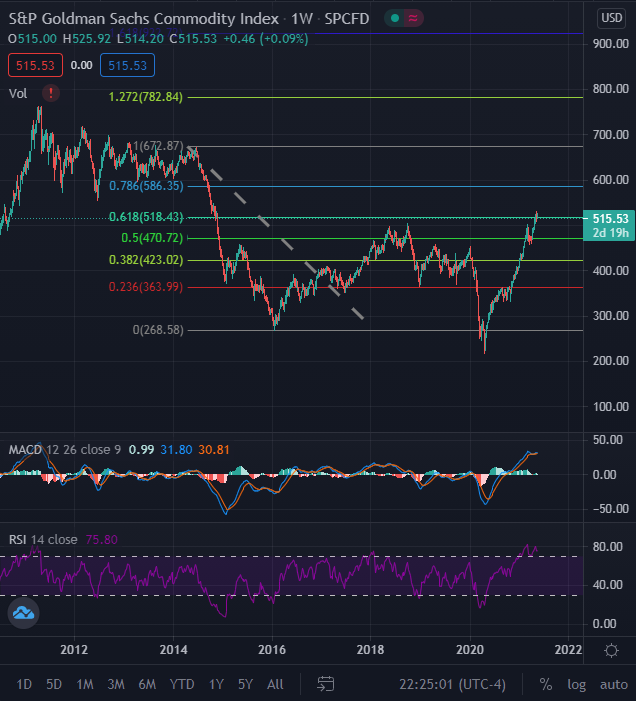
Figure 2 -S&P Goldman Sachs Commodity Index Weekly Candles (SPGSCI) July 2010 - May 18, 2021. Source tradingview.com
If you are a fan of Fibonacci retracements/extensions/time zones, you may wonder why I would draw the retracements in this way. Well, I am omitting the outlier that was Q1 of 2020 and seeing how it looks. Remember having sub-zero crude oil in March of 2020? That would certainly impact the pricing of this index. So, I omitted it. We can see weekly overbought technicals via the RSI(14) and the MACD(12,26,9), showing what may be a bearish crossover in the making in the MACD. The 61.8% retracement level here shows a 518.43 level (the way I have drawn it), and this is something to consider. Seems a bit technically overbought, yes?
Since I have opened this rabbit hole in search of a tradable opportunity, let’s look at the Invesco DB Commodity Index Tracking Fund (DBC), but on a shorter-term basis.
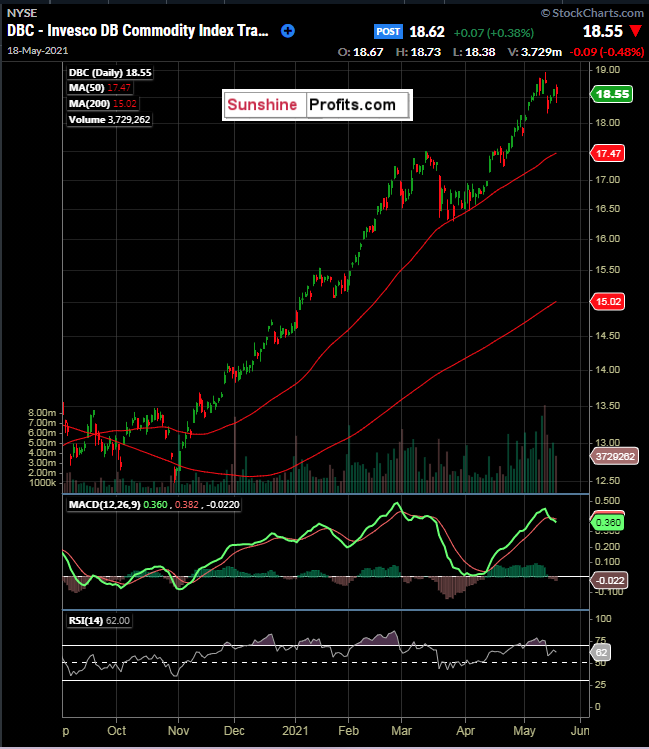
Figure 3 - Invesco DB Commodity Index Tracking Fund (DBC) Daily Candles September 3, 2020 - May 18, 2021. Source stockcharts.com
It has been a great trade from the long side. There is no doubt about it - from the bottom left of the chart to the top right, with a steep slope. I am always a “trend is your friend trader” first, as getting on the wrong side of a trend can be damaging, and very quickly. However, in this instance, I believe we need a closer look at what may be in the cards for the US Dollar and commodities.
Now, for our premium subscribers, let’s dig into the DBC short-term technicals. Not a Premium subscriber yet? Go Premium and receive my Stock Trading Alerts that include the full analysis and key price levels.
Thank you for reading today’s free analysis. I encourage you to sign up for our daily newsletter - it's absolutely free and if you don't like it, you can unsubscribe with just 2 clicks. If you sign up today, you'll also get 7 days of free access to the premium daily Stock Trading Alerts as well as our other Alerts.Sign up for the free newsletter today!
Enjoy your day! And remember to be patient with your entries.
Rafael Zorabedian
Contributor
* * * * *
This content is for informational and analytical purposes only. All essays, research, and information found above represent analyses and opinions of Rafael Zorabedian, and Sunshine Profits' associates only. As such, it may prove wrong and be subject to change without notice. You should not construe any such information or other material as investment, financial, or other advice. Nothing contained in this article constitutes a recommendation, endorsement to buy or sell any security or futures contract. Any references to any particular securities or futures contracts are for example and informational purposes only. Seek a licensed professional for investment advice. Opinions and analyses were based on data available to authors of respective essays at the time of writing. Information is from sources believed to be reliable; but its accuracy, completeness, and interpretation are not guaranteed. Although the information provided above is based on careful research and sources that are believed to be accurate, Rafael Zorabedian, and his associates do not guarantee the accuracy or thoroughness of the data or information reported. Mr. Zorabedian is not a Registered Investment Advisor. By reading Rafael Zorabedian’s reports you fully agree that he will not be held responsible or liable for any decisions you make regarding any information provided in these reports. Trading, including technical trading, is speculative and high-risk. There is a substantial risk of loss involved in trading, and it is not suitable for everyone. Futures, foreign currency and options trading contains substantial risk and is not for every investor. An investor could potentially lose all or more than the initial investment when trading futures, foreign currencies, margined securities, shorting securities, and trading options. Risk capital is money that can be lost without jeopardizing one’s financial security or lifestyle. Only risk capital should be used for trading and only those with sufficient risk capital should consider trading. Rafael Zorabedian, Sunshine Profits' employees, affiliates, as well as members of their families may have a short or long position in any securities, futures contracts, options or other financial instruments including those mentioned in any of the reports or essays, and may make additional purchases and/or sales of those securities without notice. Past performance is not indicative of future results. There is a risk of loss in trading.
© 2005-2022 http://www.MarketOracle.co.uk - The Market Oracle is a FREE Daily Financial Markets Analysis & Forecasting online publication.