


US Stock Market Indexes Consolidate Into Flagging Pattern – Watch For Aggressive Trending Soon
Stock-Markets / Stock Market 2021 Jun 04, 2021 - 01:51 PM GMTBy: Chris_Vermeulen

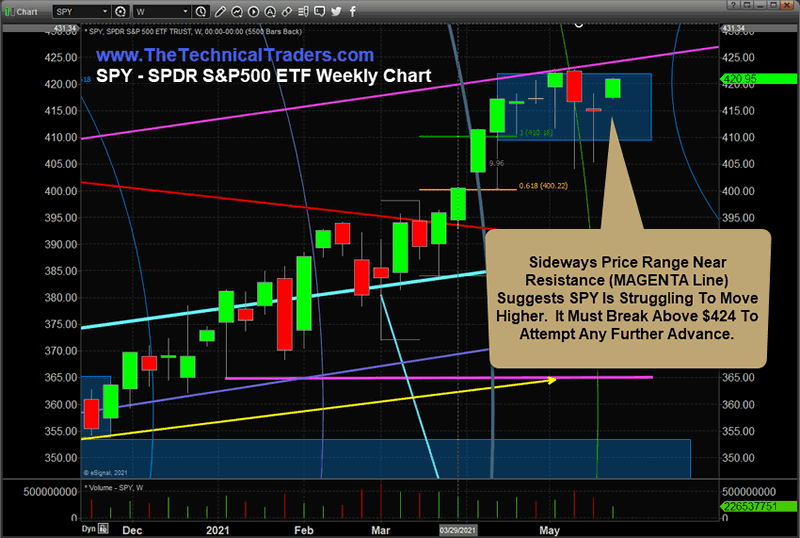
Over the past few weeks, the US major indexes have consolidated into a sideways price channel. This is most obvious on the NASDAQ and SPY charts as we’ve seen moderately deep pullbacks through the months of April/May 2021. My research suggests this sideways price Flagging might be concerning for active traders/investors.
When the market flags into a sideways price pattern and near an Apex level, price tends to act in a very aggressive manner while attempting to establish a new trend. The longer price continues to trade within that sideways/flagging price range, the more aggressive and violent the new trend may be when it finally breaks free of the sideways price channel.
After Many Weeks Of Sideways Price Trending – What’s Next?
The Weekly SPY chart, below, highlights the seven weeks of moderate sideways price activity and shows the extended resistance level (MAGENTA Line) which represents an almost extreme rally trend originating from the 2009~2011 initial price bottom/rally after the housing/credit crisis. My research team and I are cautious of how the SPY has rallied recently, targeting the prior MAGENTA Line trend level and then dramatically stalled after briefly touching this level.
Long Term SPY Chart Highlights Incredible Price – “Fuzzy Double Top” From 2009 Bottom Levels
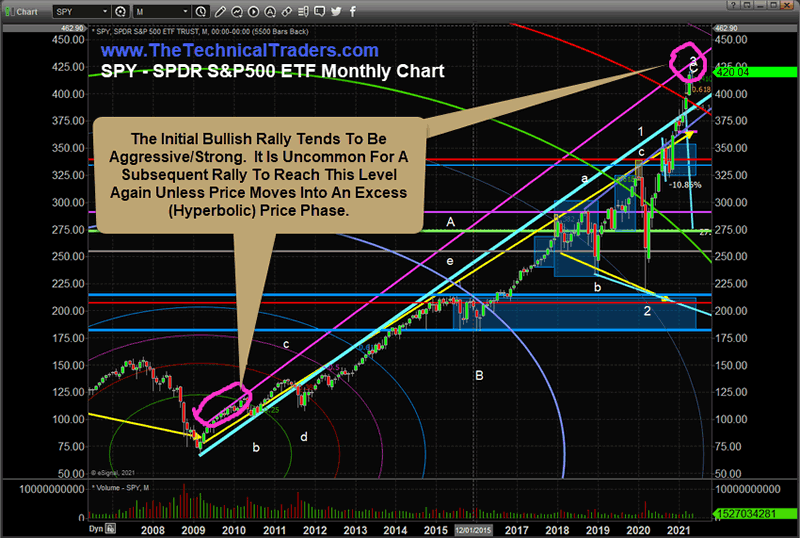
The following Monthly SPY chart shows you the bigger picture. As the bottom setup in 2009-2010, price rallied sharply and set up an upward sloping price channel off these highs. Usually, as prices move away from the bottom, a sharp recovery may take place initially after the bottom completes. This initial upward price trend often represents some of the strongest upward price momentum one will see as the bullish trend continues to unfold. It is very unusual for price to rally very strongly after a deep price bottom, then move into weaker bullish trending, then begin to accelerate into a very aggressive upward price trend targeting or reaching the initial bullish momentum after the initial deep bottom level.
Be sure to sign up for our free market trend analysis and signals now so you don’t miss our next special report!
This is exactly what happened in this case with the SPY. Price rallied off the bottom, began to stall in a bullish trend while still moving higher, then after COVID-19 began to rally excessively back to the original MAGENTA upward sloping price channel. This type of price activity is very unusual and typically relates to a hyper-parabolic price trend.
Transportation Index Forming Tight Price Flag – Which Way Will It Break?
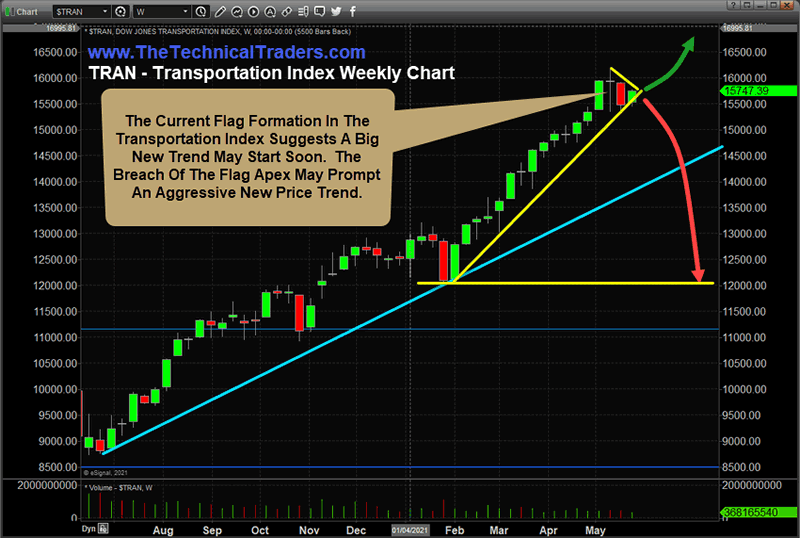
This Weekly Transportation Index highlights the Flagging price formation that has recently set up. Although one could argue the current trend is still very bullish overall, the recent sideways price formation suggests the momentum behind the recent bullish price trend has weakened. We have drawn both bullish and bearish arrows on this chart to illustrate that the Apex of the Flag formation may prompt some type of wild, volatile price activity. This Apex has nearly completed as of last week. It is very likely that a more volatile price trend will begin over the next few weeks and we believe this could be the beginning of a bigger price trend lasting through August or September 2021.
If the trend resumes as a bullish price trend, then we may continue to see a melt-up in price targeting the $16,500 level (or higher). If the trend breaks lower, then we believe the Transportation Index may attempt to move below the $14,000 level and possibly attempt to retest the early 2021 lows near $12,000.
Custom Volatility Index Confirms Bigger, Aggressive Price Trends/Breakouts Are Pending
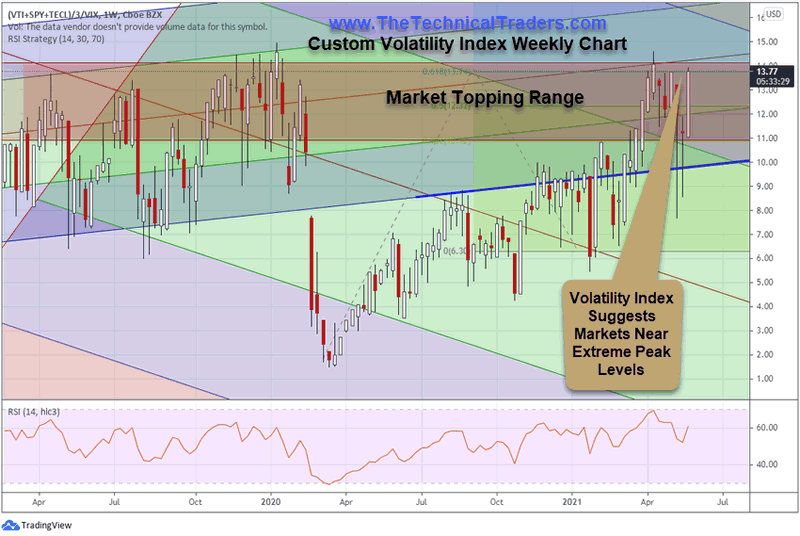
Lastly, we want to highlight our Custom Volatility Index Weekly chart – which we use to measure and gauge market peaking and bottoming setups as well as overall trend direction and momentum. When the Custom Volatility Index moves above 12~13, it is nearing an extreme bullish trend phase (or potentially nearing a peak price level where bullish momentum may stall). When the Custom Volatility Index moves below the 9~10 level after reaching the 12~13+ level, we are experiencing a moderate price pullback (usually). When the Custom Volatility Index falls below the 9~10 level, this suggests the markets are breaking major support channels and falling into a new type of Bearish trending (possibly attempting to target the 3~5 level – or lower).
Currently, the Custom Volatility Index has reached levels above 14 on April 12, 2021. That is the origination of this recent stalling in the Weekly SPY chart (near the top of this article). The current sideways price action in the SPY after April 12 was illustrated in the Custom Volatility Index as the large candlestick bars rotating near the 10~11 level. This period represents a fairly large range price volatility period where prices have stalled.
Now, the Custom Volatility Index is back above 13.50 and reached a high of 14.33. This move higher suggests the markets are back into bullish exhaustion/peaking range while the SPY and Transportation Index are still suggesting a sideways price Flag formation is Apexing. We expect some very volatile price action to pick up throughout most of June 2021 which may prompt a new major price trend in the US Major Indexes because of this setup.
As various assets seek out critical support and resistance levels in early June 2021, pay attention to how markets react near past critical stand-out lows and highs. For example, The Transportation Index chart, above, highlights a “stand-out” low near $12,000 that is a likely downside price target if we see a breakdown trend in early June. These past stand-out price levels often represent very important support and resistance levels for technical traders.
Again, we are not making a prediction that a breakdown event is going to crash the markets right now. We are suggesting that a price volatility event is about to happen in early June based on our research. This volatility event may prompt a new major price trend if the event is big enough to break through historic support/resistance levels. If not, then we may see a moderate 8 to 11% price rotation take place before the markets resume the bullish trending phase again.
We are suggesting that traders prepare for this volatility event which appears to likely happen in early June 2021 and may last many weeks (through August or September 2021). Only time will tell how this plays out, but we are fairly certain a spike in the VIX is near and that we may see a moderate downside move in the SPY – possibly below $400. Many various sectors will likely rotate as well and set up excellent opportunities for active traders throughout this volatility event.
For those of you who believe in the power of trading on relative strength, market cycles, and momentum but don’t have the time to do the research every day then my BAN Trader Pro newsletter service does all the work for you with daily pre-market reports, proprietary research, and trade alerts. More frequent or experienced traders have been killing it trading options, ETFs, and stocks using my BAN Hotlist ranking the hottest ETFs, which is updated daily for my premium subscribers. Sign up today!
Have a great day!!
Chris Vermeulen
www.TheTechnicalTraders.com
Chris Vermeulen has been involved in the markets since 1997 and is the founder of Technical Traders Ltd. He is an internationally recognized technical analyst, trader, and is the author of the book: 7 Steps to Win With Logic
Through years of research, trading and helping individual traders around the world. He learned that many traders have great trading ideas, but they lack one thing, they struggle to execute trades in a systematic way for consistent results. Chris helps educate traders with a three-hour video course that can change your trading results for the better.
His mission is to help his clients boost their trading performance while reducing market exposure and portfolio volatility.
He is a regular speaker on HoweStreet.com, and the FinancialSurvivorNetwork radio shows. Chris was also featured on the cover of AmalgaTrader Magazine, and contributes articles to several leading financial hubs like MarketOracle.co.uk
Disclaimer: Nothing in this report should be construed as a solicitation to buy or sell any securities mentioned. Technical Traders Ltd., its owners and the author of this report are not registered broker-dealers or financial advisors. Before investing in any securities, you should consult with your financial advisor and a registered broker-dealer. Never make an investment based solely on what you read in an online or printed report, including this report, especially if the investment involves a small, thinly-traded company that isn’t well known. Technical Traders Ltd. and the author of this report has been paid by Cardiff Energy Corp. In addition, the author owns shares of Cardiff Energy Corp. and would also benefit from volume and price appreciation of its stock. The information provided here within should not be construed as a financial analysis but rather as an advertisement. The author’s views and opinions regarding the companies featured in reports are his own views and are based on information that he has researched independently and has received, which the author assumes to be reliable. Technical Traders Ltd. and the author of this report do not guarantee the accuracy, completeness, or usefulness of any content of this report, nor its fitness for any particular purpose. Lastly, the author does not guarantee that any of the companies mentioned in the reports will perform as expected, and any comparisons made to other companies may not be valid or come into effect.
Chris Vermeulen Archive |
© 2005-2022 http://www.MarketOracle.co.uk - The Market Oracle is a FREE Daily Financial Markets Analysis & Forecasting online publication.