


August Stock Market Flash Crashes Historical Analysis
Stock-Markets / Stock Market Crash Aug 17, 2021 - 12:28 PM GMTBy: Chris_Vermeulen

Weakening volume after an extended rally phase is fairly common. It represents a complacency in the markets where traders/investors are unwilling to chase an extended rally phase at higher prices. Often traders are waiting for some type of market correction or rotation to happen – which will allow them to deploy capital back into the markets at decreased price levels. Sometimes, this diminishing volume presents a unique scenario where traders shift their expectations away from traditional “buy the dip” thinking and that can sometimes create what is called a Flash Crash event.
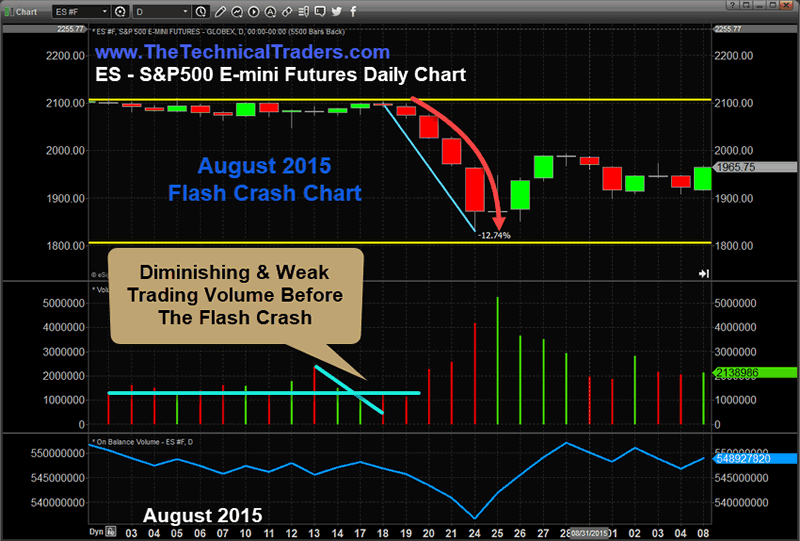
Revisiting the August 2015 Flash Crash Event
In August 2015, a unique Flash Crash took place that prompted a -12.5% collapse in the S&P 500 in just four trading days – after a bout of selling pressure on a Wednesday/Thursday/Friday. The following Monday, the markets opened with a small lower opening gap, yet traders were unwilling to buy into the ASK and this created a very unique scenario where price exploration created a widening price void. As algos and computers continued to try to find active buyers in the marketplace, the ASK/BID spreads continued to widen as the liquidity trap had sprung.
Without active participation in the price exploration process (a lack of buyers supporting the market in this case), sell-side systems kept working active orders while chasing the ASK lower and lower through the price void. This is a type of liquidity trap that unfolds when the equilibrium between active buyers and sellers becomes skewed. The price void becomes a very tangible liquidity trap that eventually closes after a substantial price move – when traders become bargain hunters and start to fill the liquidity trap.
Be sure to sign up for our free market trend analysis and signals now so you don’t miss our next special report!
It is the opinion of my team and I that the components of a Flash Crash event consist of three unique market dynamics aligning to create this type of outcome.
- Complacency in the marketplace – or lack of urgency by many traders to understand and recognize the risks within the markets right now.
- Diminishing Trading Volume – a weakening total volume level suggests traders are not actively engaging in the price exploration process. This creates the potential for a Price Void to come into existence – disrupting the normal ASK/BID spreads.
- An Extended, almost ritualistic, price trend cycle that materializes to shake traders away from normal risk protection processes. In this type of scenario, stops are very wide, or sometimes non-existent. Traders are committed to the trend and have over-leveraged themselves into the belief that “nothing could go wrong”.
In August 2015, the US markets had been trending higher since the August 2011 deep market correction (consisting of a -22% correction). The rally from those 2011 lows lasted almost 3.5 years and consisted of a +95% upside price advance before the 2015 Flash Crash. Average Volume throughout this span of time was near 2.6~2.7M shares a day. Over the 90+ days before the August 2015 Flash Crash, Daily Trading Volume dropped to 1.3~1.5M shares a day. Additionally, price had entered a decidedly sideways “melt-up” in 2015 which eventually rolled over after May/June 2015.
As we move forward into this research article, I wanted to bring something interesting to your attention. Have you noticed the deep correction in 2011 happened in August? The 2015 Flash Crash happened in August. The deep market correction in 2018 started on September 2, just days after August 2018.
Historically, August typically shows a nearly 2:1 downside propensity over the past 28+ years (for the SPY: 13 years showing an average of -6.34 vs. 15 years showing an average of +3.45). The largest Monthly positive and negative values for the SPY are +8.82 and -14.42 respectively. In other words, the month of August, or transitioning into September, can be full of very big surprises at times.
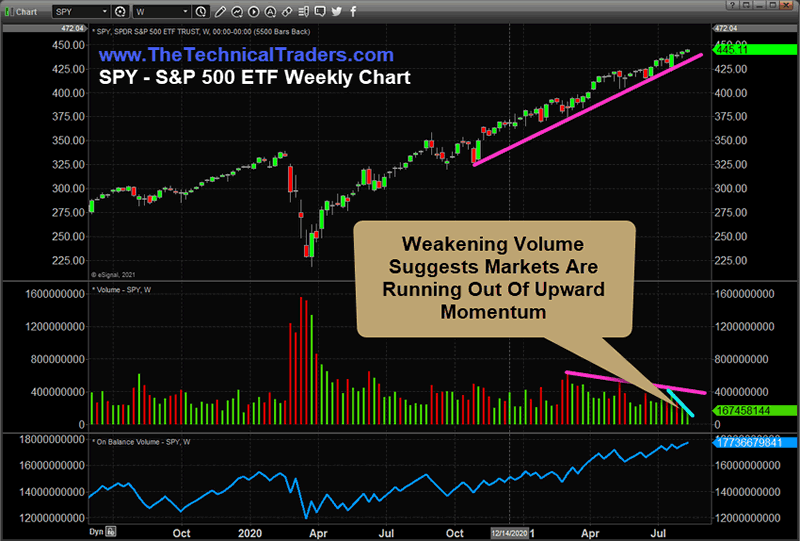
Current SPY Diminishing Volume May Be Setting Up An August Surprise
The continued melt-up over the past 8+ months since the November 2020 elections may be presenting a very real opportunity for another type of August volatility event. We are starting to see weakening volume while the SPY continues to grind higher in a more narrowing range. Recently, the dramatically weaker trading volume seems to have fallen off a cliff over the past few weeks.
The 2015 Flash Crash set up on the week of August 10 through August 14. Oddly, today is August 12, 2021. Are we setting up for another type of volatility event, or Flash Crash, right now with this diminishing volume?
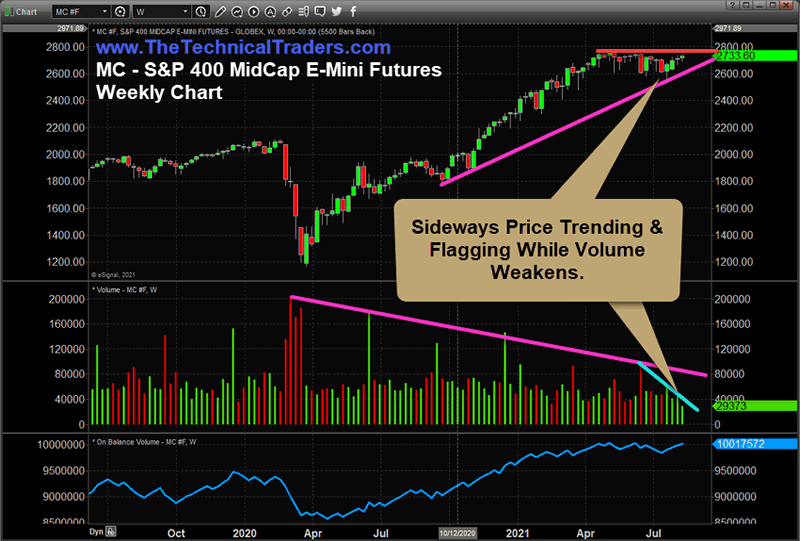
S&P 400 MidCap Futures Show A Very Clear Diminishing Volume Setup
Historically, the average volume on this MC, S&P 400 MidCap Weekly Chart, has been somewhere near 65,000 to 75,000 over the past 2+ years. Currently, the average Weekly trading volume has dropped to approximately 38,000 to 44,000 over the past 6+ months. Additionally, we’ve seen a dramatic decline in volume over the past 3+ weeks – almost as if volume levels have fallen off a cliff while price has continued to move in a decidedly sideways price channel.
As we continue to push through the month of August, it might be wise to reconsider risks related to an August surprise while continuing to focus on protecting assets and growing wealth over time. We are not trying to push any fear into your heads related to our research, we are simply pointing out the similarities to the 2015 Flash Crash and the August Surprise events that have taken place over the past 8+ years.
Our data shows that August typically presents a 2:1 downside price volatility exception even though August has historically been higher 15 of the last 28 years. That means that August may continue higher with a nearly 55% chance of no August Surprise event. But the flip-side of that is there is nearly a 45% chance that a broad downside market event will take place in August that may be in excess of -6.34 to -14.42 points for the SPY. Translating that for the MC would represent -50.33 to -95.5 points with roughly the same accuracy ratio.
One thing is certain, there are only about 12 more trading days in August 2021. We’ll know soon enough if there is going to be any type of volatility event associated with the diminishing volume we are seeing in the markets right now. There is not much time left for this event to take place – only about 15 to 25+ days based on our expectations.
More than ever, right now, traders need to move away from risk functions and start using common sense. There will still be endless opportunities for profits from these extended price rotations, but the volatility and leverage factors will increase risk levels for traders that are not prepared or don’t have solid strategies. Don’t let yourself get caught in these next cycle phases unprepared.
Please take a minute to learn about my BAN Trader Pro newsletter service and how it can help you identify and trade better sector setups. My team and I have built this strategy to help us identify the strongest and best trade setups in any market sector. Every day, we deliver these setups to our subscribers along with the BAN Trader Pro system trades. You owe it to yourself to see how simple it is to trade 30% to 40% of the time to generate incredible results.
As something entirely new, check out my initiative URLYstart to learn more about the youth entrepreneurship program I am developing. This is an online program of gamified entrepreneurship designed to introduce and inspire kids to start their own businesses. Click-by-click, each student will be guided from their initial idea, through the startup process all the way to their first sale and beyond. Along the way, our students will learn life lessons such as communication, perseverance, goal setting, teamwork, and more. My team and I are passionate about this project and want to reach as many kids as possible!
Have a great day!
Chris Vermeulen
www.TheTechnicalTraders.com
Chris Vermeulen has been involved in the markets since 1997 and is the founder of Technical Traders Ltd. He is an internationally recognized technical analyst, trader, and is the author of the book: 7 Steps to Win With Logic
Through years of research, trading and helping individual traders around the world. He learned that many traders have great trading ideas, but they lack one thing, they struggle to execute trades in a systematic way for consistent results. Chris helps educate traders with a three-hour video course that can change your trading results for the better.
His mission is to help his clients boost their trading performance while reducing market exposure and portfolio volatility.
He is a regular speaker on HoweStreet.com, and the FinancialSurvivorNetwork radio shows. Chris was also featured on the cover of AmalgaTrader Magazine, and contributes articles to several leading financial hubs like MarketOracle.co.uk
Disclaimer: Nothing in this report should be construed as a solicitation to buy or sell any securities mentioned. Technical Traders Ltd., its owners and the author of this report are not registered broker-dealers or financial advisors. Before investing in any securities, you should consult with your financial advisor and a registered broker-dealer. Never make an investment based solely on what you read in an online or printed report, including this report, especially if the investment involves a small, thinly-traded company that isn’t well known. Technical Traders Ltd. and the author of this report has been paid by Cardiff Energy Corp. In addition, the author owns shares of Cardiff Energy Corp. and would also benefit from volume and price appreciation of its stock. The information provided here within should not be construed as a financial analysis but rather as an advertisement. The author’s views and opinions regarding the companies featured in reports are his own views and are based on information that he has researched independently and has received, which the author assumes to be reliable. Technical Traders Ltd. and the author of this report do not guarantee the accuracy, completeness, or usefulness of any content of this report, nor its fitness for any particular purpose. Lastly, the author does not guarantee that any of the companies mentioned in the reports will perform as expected, and any comparisons made to other companies may not be valid or come into effect.
Chris Vermeulen Archive |
© 2005-2022 http://www.MarketOracle.co.uk - The Market Oracle is a FREE Daily Financial Markets Analysis & Forecasting online publication.