


S&P500 Stock Market Crash Compared to Nikkei Index
Stock-Markets / Financial Crash Oct 23, 2008 - 11:49 AM GMTBy: Mike_Shedlock

 This article features a long term comparison between the S&P 500 Index and the Japanese stock market as measured by the Nikkei Index. The Nikkei peaked almost two decades ago.
Here is the first chart to consider.
Nikkei Monthly Chart
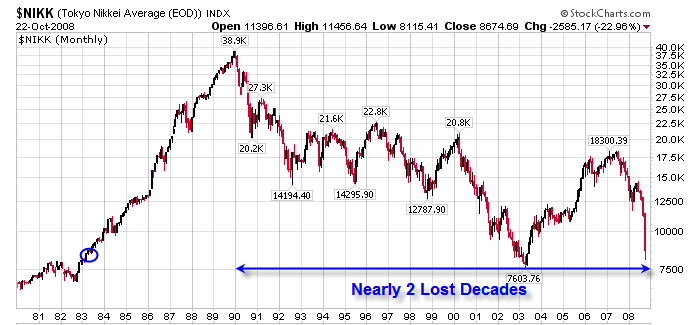
The period from 1990 to 2000 has often been called "Japan's Lost Decade". It's now just a year away from becoming two lost decades. And except for one brief point in 2003, The Japanese stock market is lower than it has been at any time in the last 25 years dating all the way back to 1983.
In 1990 the Nikkei peaked at 38,900. It is sitting at 8,438 as I type. After 19 years of ups and downs including one big rally of 140%, the Nikkei is down a whopping 78%!
Think That Can't Happen Here?
If you think that can't happen here, then consider this chart of the S&P 500 over the same period.
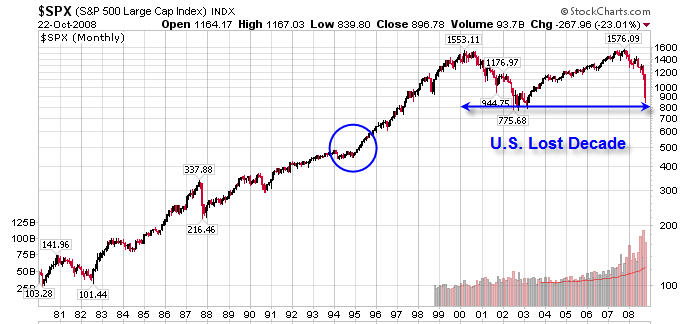
Someone buying the S&P 500 in 2000 is down 40% nine years later. Buy and hold dollar cost averaging has been an absolute disaster. You would be behind on nearly every addition no matter when you started.
Note the blue circle in the above chart is roughly 15 years ago. That represents one and a half "lost decades" in time. I circled that zone because it just happens to coincide with an S&P 500 Elliot Wave Count of the decline we are in.
S&P 500 Crash Count
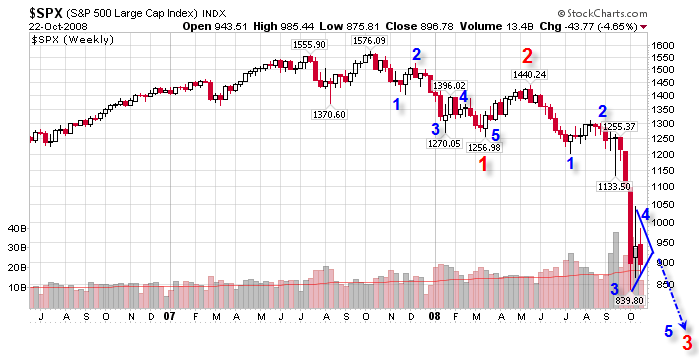
Please see S&P 500 Crash Count for an explanation of the count and its likely meaning.
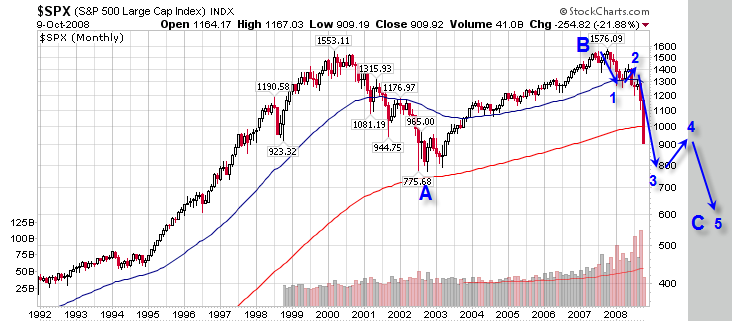
Possible Pattern
Update:
The first S&P chart above is an update from the original article. The main difference is that it is now clear that we have finished wave 3 of 3 down and are in wave 4 of 3 up or possibly wave 5 of 3 down depending on what happens in the market next.
The important point is that we are still on track for a downside target of 450-600 on the S&P 500. That does not mean we get there, it just means it is a likely target.
If we do get to the 450-600 target area, do not expect to see the stock market blasting to new highs for as long as two decades, just as happened in Japan. Indeed, from the current look of things, Japan can still be decades away from new highs.
If this scenario seems farfetched, please consider a few fundamentals.
S&P 500 Fundamentals
- The period from 2003 to 2008 was the biggest credit bubble in history, not just in the US but worldwide. It is unrealistic to expect the bust to be anything other than the biggest credit bust in history.
- Unemployment is 6.1% and rising. My unemployment target is 8% for 2009 and continuing higher into 2010.Think what rising unemployment will do to foreclosures, defaults on credit cards, bankruptcies, commercial real estate, and corporate earnings.
- Banks and brokerages made immense profits being leveraged 30-1 to 50-1. However, brokerages are now under control of the Fed. Leverage is still unwinding and will be lowered to 10-1 or possibly lower. Reduced leveraged means less risk, but also reduced lower profit opportunity.
- Boomers are heading into retirement, and a portion of their retirement plan (rising home prices) has been wiped out. Another portion of boomer retirement plans are being wiped out in the stock market crash.
- As a result of the above, those boomers will be doing less spending and more savings. Don't expect retail sales or store profits to come soaring back anytime soon.
- Peak Credit has been reached and a secular shift to frugality and risk aversion has begun.
- Stock markets returning from extreme conditions do not just drop to the trendline, they overshoot it.
- Children who have seen their parents wiped out in bankruptcy or foreclosed on are going to have a completely different attitude towards debt than their reckless parents did. Expect to see more frugality from parents and their children alike.
It is impossible to predict the future of course, but fundamentally as well as technically there is every reason to believe lower lows are coming, and the rebound off those lows will be anemic compared to past recoveries. Those looking for an L shaped recession are likely looking the right direction.
By Mike "Mish" Shedlock
http://globaleconomicanalysis.blogspot.com
Click Here To Scroll Thru My Recent Post List
Mike Shedlock / Mish is a registered investment advisor representative for SitkaPacific Capital Management . Sitka Pacific is an asset management firm whose goal is strong performance and low volatility, regardless of market direction.
Visit Sitka Pacific's Account Management Page to learn more about wealth management and capital preservation strategies of Sitka Pacific.
I do weekly podcasts every Thursday on HoweStreet and a brief 7 minute segment on Saturday on CKNW AM 980 in Vancouver.
When not writing about stocks or the economy I spends a great deal of time on photography and in the garden. I have over 80 magazine and book cover credits. Some of my Wisconsin and gardening images can be seen at MichaelShedlock.com .
© 2008 Mike Shedlock, All Rights Reserved
Mike Shedlock Archive |
© 2005-2022 http://www.MarketOracle.co.uk - The Market Oracle is a FREE Daily Financial Markets Analysis & Forecasting online publication.