


Silver Price seen tracking Copper prices higher
Commodities / Gold and Silver 2021 Sep 10, 2021 - 05:54 PM GMTBy: Richard_Mills

As a keen observer of the silver market, something recently caught my eye concerning the relationship between silver and gold (well-recognized) and silver and copper (less so).
Traditionally, silver prices have tracked gold prices fairly closely, which makes sense given that both function as monetary metals, and they often occur together in mineral deposits. The correlation between gold and silver since 1975 has been 0.8876. The 10-year correlation coefficient is 0.7511. However this year, the correlation has dropped significantly to 0.1959.
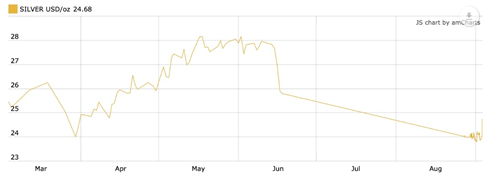
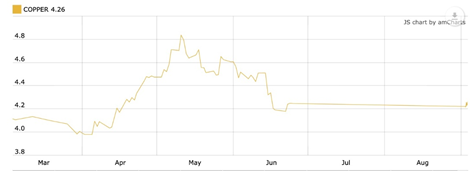
I suggest the reason is the fact that both copper and silver are being increasingly demanded in green energy applications. The closer correlation is seen below in the similar-shaped line graphs of 6-month spot silver and copper.
This is something we at AOTH will definitely be watching.
Silver and copper
Over the past several months, we have covered the rising prices of industrial metals such as copper, nickel, zinc and lead.
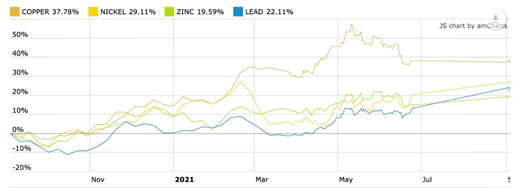
As countries continue to vaccinate their populations, economies are returning to growth, spurring demand for cars, electronics, clothing, and infrastructure for urban renewal. This means more nickel for stainless steel structures, galvanized steel (zinc) for suspension bridges, copper for electrical wiring & plumbing, lead for batteries, etc.
According to the OECD, the world economy is expected to grow at 5.8% this year, a sharp upward revision from the December 2020 estimate of 4.1%.
The US economy is running hot, owing to massive federal stimulus, more job openings and higher consumer spending, and that has caused demand for a lot of goods and services to outstrip the ability of companies to supply them.
Toss in virus-related supply chain bottlenecks, including a shortage of labor in some industries, causing wages to rise, and we have the highest inflation in more than a decade — 5.4% in June and July. US corporate profits surged to a new record high in the second quarter, while Q2 GDP growth was raised to 6.6%, up slightly from the 6.5% reported in July.
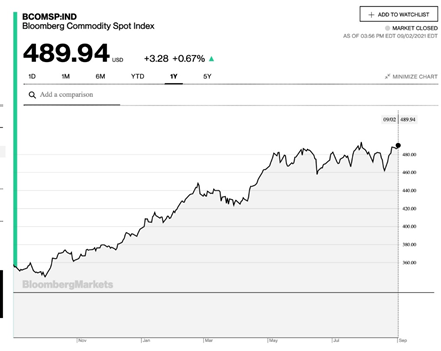
Bullish market fundamentals for commodities pushed the Bloomberg Commodity Spot Index to a 10-year high and the index is close to matching the record set in 2011, the height of the last commodities super-cycle. Materials with excellent price performances include copper, which in May hit a record high $10,460 a tonne ($4.74/lb) and continues to trade above $4.00; Brent crude oil which has doubled in price since November 2020; and a number of agricultural commodities such as corn, soybeans, coffee and wheat.
Economically this is a time of transition, as old-school technologies such as coal-fired power plants and gas-guzzling cars and trucks, give way to electric vehicles and price-competitive grid-scale renewables, chiefly wind and solar.
Some including investment bank Goldman Sachs, are pointing to the formation of a new commodities supercycle, driven not by fossil fuels and the rise of China, such as occurred in the 2000s, but by so-called “green” metals needed to electrify and decarbonize, to avoid the worst effects of climate change.
According to a recent report from Wood Mackenzie, mining companies will need to spend $1.7 trillion over the next 15 years, to supply enough lithium, graphite, cobalt, copper and nickel for the shift to a low-carbon world.
The commodities consultancy says meeting new emissions targets being set by countries like Canada, the US, Britain, China and Japan, will mean large-scale deployment of electric vehicles, renewable power and electrical transmission, all of which will require copious metal content.
Two of the metals illustrative of this shift, are silver and copper.
Silver demand
Much of silver’s value is derived from its industrial demand and supply fundamentals. It’s estimated around 60% of silver is utilized in industrial applications, like solar panels and electronics, leaving only 40% for investing.
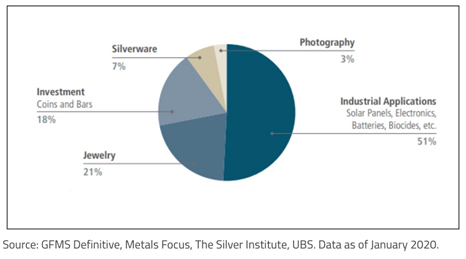
Silver applications, data as of January 2020. Source: GFMS Definitive, Metals Focus, The Silver Institute, UBS
More and more silver is being demanded for use in solar photovoltaic (PV) cells, as countries move towards adopting renewable energy sources.
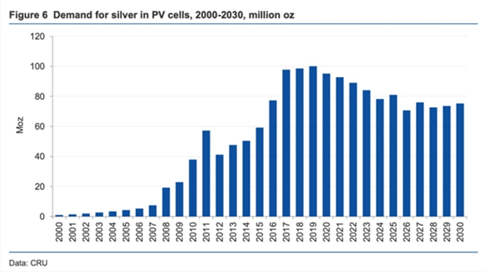
As the metal with the highest electrical and thermal conductivity, silver is ideally suited to solar panels. Silver paste within the solar cells ensure the electrons move into storage or towards consumption, depending on the need. It is estimated that about 100 million ounces of silver are consumed per year for this purpose alone.
This figure is expected to rise in the coming years, with continued growth of electricity demand and renewable energy aspirations all pointing to rising solar power penetration.
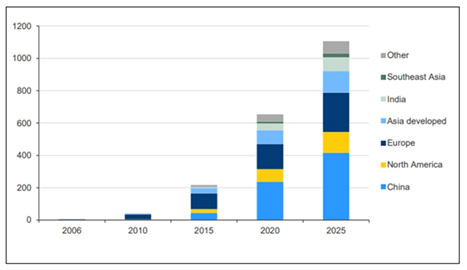
Historical and forecast solar capacity by region, 2006-2025.
Source: The Silver Institute & CRU Consulting
One projection has annual silver consumption by the solar industry growing 85% to about 185 million ounces within a decade, according to a report by BMO Capital Markets.
Coming off a record year despite the pandemic, the US solar industry will likely be one of the leading drivers of silver demand. Installations grew 43% year over year in 2020, reaching a record 19.2 gigawatts of new capacity. By 2030, solar installations are expected to quadruple from current levels, according to a report from the Solar Energy Industries Association and Wood Mackenzie.
As most solar panels used in the US come from Asia, the recent Biden administration ban on solar panels from China, over forced labor concerns, places the US solar industry in a bind, potentially sparking a surge in domestic silver exploration.
5G technology is set to become another big new driver of silver demand.
Among the 5G components requiring silver, are semiconductor chips, cabling, microelectromechanical systems (MEMS), and Internet of things (IoT)-enabled devices.
The Silver Institute expects silver demanded by 5G to more than double, from its current ~7.5 million ounces, to around 16Moz by 2025 and as much as 23Moz by 2030, which would represent a 206% increase from current levels.
A third major industrial demand driver for silver is the automotive industry.
Silver is also found in many car components throughout vehicles’ electronic systems, and despite not being used in batteries, its superior electrical properties make it hard to replace across a wide and growing range of automotive applications.
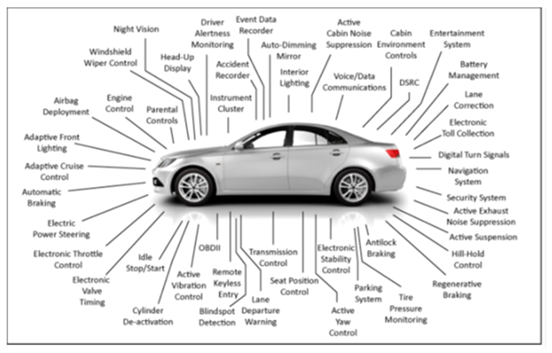
Automotive electrical and electronic components. Source: The Silver Institute
A recent Silver Institute report says battery electric vehicles contain up to twice as much silver as ICE-powered vehicles, with autonomous vehicles requiring even more due to their complexity. Charging points and charging stations are also expected to demand a lot more silver.
According to SI, silver’s use in the automotive market will see a strong rebound in 2021, to just over 60Moz. It estimates the sector’s demand for silver will rise to 88Moz in five years as the transition from traditional cars and trucks to EVs accelerates. Others estimate that by 2040, electric vehicles could demand nearly half of annual silver supply.
Finally, silver demand for “printed and flexible electronics” is forecast to increase 54% over the next nine years, rising from 48Moz in 2021 to 74Moz in 2030, meaning a consumption of 615Moz during this time frame.
A recent Silver Institute news release describes them as “mainstays” in a variety of electronic products, including sensors that measure everything from temperature, pressure and motion, to moisture, relative humidity and carbon monoxide. They are also used in medical devices, mobile phones, appliance displays and consumer electronics.
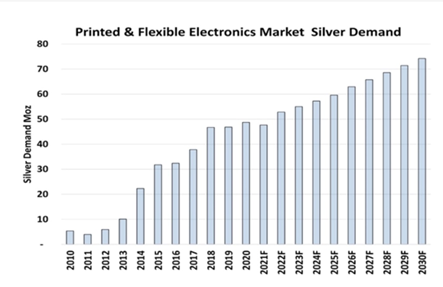
Printed and flexible electronics market silver demand.
Source: Precious Metals Commodity Management LLC
Earlier this year, a comprehensive report by Sprott titled ‘Silver’s Clean Energy Future’ found that three areas of growing demand for silver — solar, automotive and 5G — potentially account for more than 125 million ounces in 10 years. This doesn’t include the growth in investment demand for silver, which as mentioned represents about 40% of usage.
Total mined silver supply in 2020 was 25,000 tonnes, or 881.8 million ounces.
The higher usage of silver for industrial purposes, along with safe-haven demand for precious metals during a once in a century pandemic, last year lifted silver prices significantly.
Spot silver jumped to $28.32 an ounce in August 2020, its best performance in seven years, finishing the year up an impressive 47%, more than doubling gold’s 25% gain.
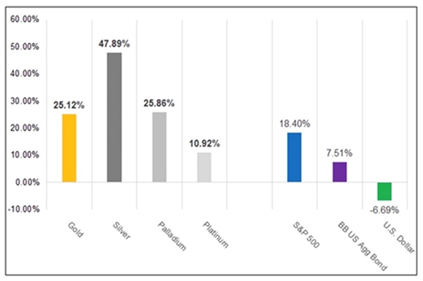
Silver climbed 47.8% in 2020. Source:
Bloomberg via Sprott Insights
While silver prices have softened over the past year, the outlook is positive due to a combination of strong monetary and industrial demand drivers.
According to the 2021 World Silver Survey, global demand for silver this year is expected to outpace supply by 7% (+8% supply vs +15% demand).
Demand will be led by investments in industrial and investment-grade physical silver, as a result of economic recovery from the pandemic, as well as healthy coin and bar purchases building on 2020’s gains.
Silver supply
The bullish case for silver also has a supply dimension.
Silver is vulnerable to supply disruptions, more so than gold, because there are relatively few pure-play silver mines.
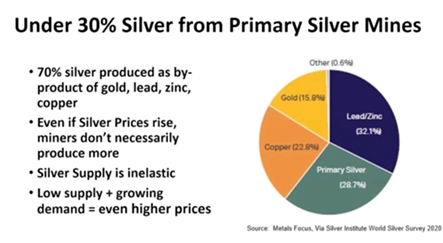
Only around 30% of annual supply comes from primary silver mines. Over two-thirds is sourced from polymetallic ore deposits, including lead/zinc operations and copper mines.
In 2020 mined silver slumped the most in a decade, owing to a number of coronavirus-related mine closures in Latin America where the majority of silver is produced. It fell 5.9% to 784.4 million ounces, according to the 2021 World Silver Survey.
“Native silver” found in the Earth’s crust on its own, is relatively rare. More commonly, it is mined alongside gold, or as a by-product of zinc-lead ore.
While most mined gold is still in existence, either cast as jewelry, or smelted into bullion and stored for investment purposes, the same cannot be said for silver. As mentioned, it is estimated around 60% of silver is utilized in industrial applications, leaving only 40% for investing. Of the 60% used for industrial applications almost 80% ends up in landfills.
Despite silver being about 17.5 times more plentiful than gold in the Earth’s crust, silver and gold have roughly the same amount, ~2.5 billion ounces, available for investment purposes.
However, since very little gold is used by industry, it trades as an investment commodity — prices moving up and down in relation to factors like the US dollar, inflation, interest rates and sovereign bond yields.
In comparison, silver commands a relatively small amount for investment, just 40% of supply. Because over half of supply is needed for industrial applications, silver usually trades more like an industrial metal than an investment commodity.
This also explains silver’s volatility. Because the investment market for silver is so small (60% is locked up in industrial uses) prices swing up and down wildly, at relatively low volumes. For this reason, investors nicknamed silver “the devil’s metal”.
Will mined silver supply be able to keep up with the explosive demand for silver outlined in the last section? I don’t like its chances. In an earlier article we showed we have already reached peak mined silver.
In 2020 mined silver slumped the most in a decade, owing to a number of coronavirus-related mine closures in Latin America where the majority of silver is produced. It fell 5.9% to 784.4 million ounces, according to the 2021 World Silver Survey.
However, as a result of higher silver prices in the second half of the year, global silver recycling rose by 7%, hitting a 7-year high of 182.1Moz. Scrap generated from industrial end uses also climbed higher last year.
Combined, therefore, we have total silver supply reaching 966.5Moz in 2020.
How about demand? According to the World Silver Survey, after rising for two years, in 2020 silver demand weakened by 10%, with most of the losses attributed to a fall in industrial demand, resulting from the pandemic.
Industrial fabrication slumped to a five-year low in 2020, leaving total silver demand at 896.1Moz.
No peak silver here, right? Demand of 896.1Moz is more than satisfied by supply of 966.5Moz.
But when we strip recycling out of the equation, 182.1Moz, we get an entirely different result. ie. 896.1Moz of demand minus 784.4Moz mine supply leaves a deficit of 111.7Moz.
This is significant, because it’s saying even though industrial demand for silver, which makes up about 60% of usage, got slammed last year due to the pandemic, the total demand, industrial plus investment, was greater than mine supply (which admittedly had a bad year due to shutdowns) by about 100Moz.
Only by recycling 182.1Moz could silver demand be satisfied in 2020.
Copper demand
Curiously, copper is often overlooked when tallying up the metals required for the transition to clean energy and electrification. There is no shift from fossil fuels to green energy without copper, which has no substitutes for its uses in EVs, wind & solar energy.
Copper’s widespread use in construction wiring & piping, and electrical transmission lines, makes it a key metal for civil infrastructure renewal.
A report by Roskill forecasts total copper consumption will exceed 43 million tonnes by 2035, driven by population and GDP growth, urbanization and electricity demand. Total world mine production in 2020 was only 20Mt.
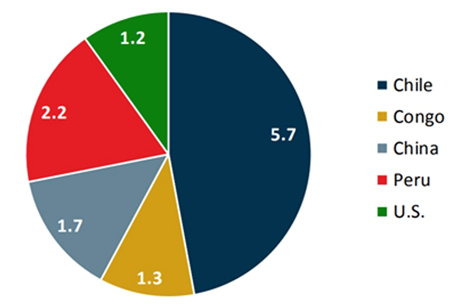
2020 copper mine production in millions of tonnes. Source: USGS
The continued movement towards electric vehicles is a huge copper driver. EVs use about four times as much copper as regular internal combustion engine vehicles.
Electrification includes not only cars, but trucks, trains, delivery vans, construction equipment and two-wheeled vehicles like e-bikes and scooters.
The latest use for copper is in EVs and their charging stations, renewable energy, particularly in photovoltaic cells used for solar power, and wind turbines. The base metal is also a key component of the global 5G buildout. Even though 5G is wireless, its deployment involves a lot more fiber and copper cable to connect equipment located within a building.
Copper supply
But this hurtling freight train of copper demand is about to slam into the immovable object of a supply crunch.
Some of the largest copper mines are seeing their reserves dwindle; they are having to dramatically slow production due to major capital-intensive projects to move operations from open pit to underground. Examples include Grasberg in Indonesia, the world’s second largest copper mine. The mine began as a large open pit but after decades of extracting it, the easy-to-reach ore is gone and future production is expected to come from a deep cave deposit known as the Deep Mill Level Zone. Copper concentrate exports have plunged dramatically as operations shift from open pit to underground.
In Chile, a $5 billion expansion at Chuquicamata, also moving operations from open pit to underground, will take five years to reach full output of 300,000 tonnes per annum — this is not new production.
Shipments from BHP’s Escondida took a hit in 2019 due to operations moving underground. The largest copper mine on the planet is expected to take until 2022 to re-gain full output, again not new production.
These cuts are significant to the global copper market because Chile is the world’s biggest copper-producing nation — supplying 30% of the world’s red metal. Adding insult to injury, copper grades have declined about 25% in Chile over the last decade, bringing less ore to market.
In fact the world could face a large shortfall in the next decade unless the copper mining industry makes major investments.
According to CRU Group, via Bloomberg, the industry needs to spend upwards of $100 billion to close a potential annual supply deficit of 4.7 million tonnes by 2030, as the clean power and transportation sectors call for much higher demand.
Closing this gap would require building the equivalent of eight “Escondidas”, referring to the world’s largest copper mine in Chile.
StoneX, a Fortune-100 financial services firm, forecasts copper demand in 2021 will rise about 5% compared to last year, moving global copper supply from a small surplus in 2020 to a more than 200,000-tonne deficit.
One of the problems with copper is it is difficult to find in large enough amounts close to surface, where it’s economical to extract. It also takes many years to bring a copper deposit into production, especially in places like the United States and Canada where miners face strict permitting regulations that can cause delays. According to Bloomberg Intelligence, the average lead time from first discovery to first metal has increased by four years from previous cycles, to almost 14 years.
“Increasing technical complexity and approval delays could lead to a dearth of shovel-ready projects in 2025-30,” Bloomberg Intelligence analysts Grant Sporre and Andrew Cosgrove wrote in a recent report.
According to Goehring & Rozencwajg Associates, the number of new world-class discoveries coming online this decade “will decline substantially and depletion problems at existing mines will accelerate.”
Also, geological constraints surrounding copper porphyry deposits, a subject few industry analysts let alone investors understand, will contribute to the problems, the Wall Street firm said in a 2021 report.
By 2015, the industry’s head grade was already 30% lower than in 2001, and the capital cost per tonne of annual production had surged four-fold during that time — both classic signs of depletion.
According to G&R the industry is “approaching the lower limits of cut-off grades,” and brownfield expansions are no longer a viable solution.
“If this is correct, then we are rapidly approaching the point where reserves cannot be grown at all,” the report concluded.
Could we be facing a situation of peak copper? Well, yes. In fact we proved it.
The definition of peak copper (or peak anything) is when production stops growing. If reserves aren’t increasing, there will eventually be nothing left to mine. Production will have to reach a peak, then decline.
This in itself is a shocking revelation. It suggests the copper mining industry has gone as far as it can in lowering cut-off grades further, meaning it is no longer possible to add large amounts of reserves — especially given that porphyry deposits are typically low-grade, in the 0.3 to 0.4% Cu range. The industry, the report alludes to, is nearing its production peak:
Our models strongly suggest copper mine supply growth will grind to a halt this decade. The number of new world-class discoveries coming online will decline substantially and depletion problems at existing mines will accelerate. Also, geological constraints surrounding copper porphyry deposits, which is where we get 80% of our copper, a subject few analysts and investors understand, will contribute to the problems.
Greenfield and brownfield reserve additions are expected to disappoint through the decade, according to the report. S&P Global Market Intelligence estimates that new discoveries averaged nearly 50Mt annually between 1990 and 2010. Since then, new discoveries have fallen by 80% to only 8Mt per year.
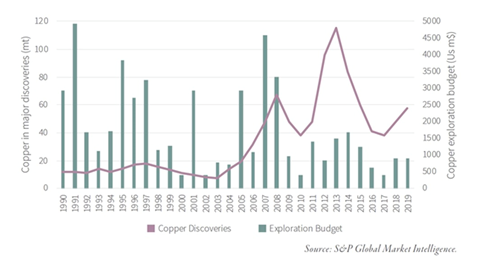
Copper discoveries and capital expenditures
Goehring & Rozencwajg therefore forecast that stagnating copper mine supply, already colliding with strong demand, will push copper prices far higher than anyone expects.
“The previous copper bull market took place between 2001 and 2011 and saw prices rise seven-fold: from $0.60 to $4.62 per pound. The fundamentals today are even more bullish,” the firm states, adding:
“We would not be surprised to see copper prices again advance a minimum of seven-fold before this bull market is over. Using $1.95 as our starting point, we expect copper prices to potentially peak near $15 per pound by the latter part of this decade.”
Spot copper nearly doubled between a March 2020 pandemic low and March 2021; it is up 21% year to date.
The main factors driving prices higher are increased Chinese orders amid a strong manufacturing sector; expectations of a return to growth following a disastrous 2020; trillions in promised green and blacktop infrastructure spending particularly in the US, Europe, and China; and supply disruptions resulting from virus-related mine closures.
Gold & silver
Silver as money
Silver now is primarily an industrial metal, but it wasn’t always this way. For much of the 19th century, silver played an important role in the US monetary system. Before that, silver coins were in usage for thousands of years, all over the world.
About 700 BC silver started being used as a currency — a role it has maintained in nearly every ancient and modern culture. About 85% of the world’s silver came from mines in Bolivia, Peru and Mexico between 1500 and 1800. The drachma coin of ancient Greece, the Roman denarius and British pound sterling all contained a percentage of silver.
Many scholars consider the silver trade to mark the beginning of the global economy, with one historian noting that silver “went round the world and made the world go round.”
The precious metal has made an indelible mark on Chinese history, helping both to build an empire and to destroy it.
Silver helped fuel an “economic miracle” in the Middle Kingdom following the Single Whip tax reform.
Craftsmen began designing and manufacturing goods for foreign buyers in Europe and Spanish America (by this time the Spanish had also conquered Mexico) — in a prelude to what was to occur centuries later when China became the “workshop of the world”.
But silver wasn’t only responsible for carrying the Ming dynasty to new heights. An ocean away, in the New World, the early global economy was beginning to take shape.
In 1573 a mint that opened in Potosi, modern-day Bolivia, became the beating heart of world commerce, producing the first global currency, which came to be known as “Pieces of 8”.
At first used in Spanish colonies, eventually the Pieces of 8, or Spanish dollar, became accepted as currency in every corner of the world.
(The coins were called that because to make change, they were literally cut into eight pieces or bits. When something cost “two bits”, it meant a quarter of a Spanish dollar, or two Pieces of 8. The Pieces of 8 remained legal tender in the United States until the Coinage Act of 1857)
For the first time in history, countries were starting to become connected, bound together by a single, crucial element: silver.
As countries moved to paper money, they fixed one unit of currency to a weight in gold, a system that became known as the gold standard. Britain was the first to adopt the gold standard, in 1717, and other countries soon followed suit. In the 19th century, all countries except China used it. Domestic currencies were freely convertible into gold at the fixed price and there was no restriction on the import or export of gold.
In 1784 Thomas Jefferson said, “If we determine that a dollar shall be our unit, we must then say with precision what a dollar is.”
The founding fathers followed his advice and in 1792 defined one dollar — a local version of the popular Spanish dollar — as 371 grains of silver. The bi-metallic gold and silver standard for the nation’s newly minted currency valued gold at $19.30 per ounce.
In 1873, the US Congress omitted the silver dollar from the list of authorized coins (the so-called “Crime of ‘73”), prompting the rise of the Free Silver Movement.
As Wikipedia explains, the “Silverites” advocated for an expansionist monetary policy featuring the unlimited coinage of silver into money on-demand, as opposed to strict adherence to the carefully fixed money supply implicit in the gold standard.
Supporters included silver miners in the West; farmers who believed an expanded currency beyond gold and the US dollar, which became legal tender in 1862, would increase crop prices; and debtors who hoped it would enable them to pay their debts more easily.
Adherents saw silver occupying an important place in a bi-metallic monetary system, whereby silver dollars would be fixed at a ratio of 16:1 against dollar coins made of gold.
The movement’s first success was the Bland-Allison Act of 1878. The act restored the silver dollar as legal tender and required the US Treasury to purchase each month between $2 million and $4 million worth of silver and coin it into dollars.
When land and farm prices collapsed in 1887, farmers pushed for unlimited silver coinage. The 1890 Sherman Silver Purchase Act increased the government’s monthly silver purchases by 50%, but in the years that followed, Encyclopedia Britannica explains, a combination of pressures sharply reduced the amount of gold in the U.S. Treasury, precipitating a panic in the spring of 1893. Conservatives charged that the Sherman Act was the cause of the panic, and in the summer of 1893 Congress repealed that act. Farmers in the South and West condemned this action, blamed the greed of eastern bankers for the depressed state of the economy, and resumed their demand for the unlimited coinage of silver.
This had been an important objective of the Populist Party in the election of 1892, and in 1896 the Democrats, despite strong opposition from President Grover Cleveland, made unlimited coinage of silver the principal plank in their platform. They then nominated William Jennings Bryan, the most effective champion of free silver (see Cross of Gold speech), as their candidate for president. The Republicans won the election, and in 1900 a Republican majority in Congress enacted the Gold Standard Act, which made gold the sole standard for all currency.
The Free Silver Movement was divisive, in that it exploited class divisions and the gap between owners and workers. In Wikipedia’s account,
Free silver became increasingly associated with populism, unions, and the fight of ordinary Americans against the bankers, railroad monopolists, and the robbers of the Gilded Age capitalism era and was referred to as the “People’s Money” (as opposed to the gold-based currency, which was portrayed by the Populists as the money of “exploitation” and “oppression”)…
The “free silver” debate pitted the pro-gold financial establishment of the Northeast, along with railroads, factories, and businessmen, who were creditors deriving benefit from deflation and repayment of loans with valuable gold dollars, against farmers who would benefit from higher prices for their crops and an easing of credit burdens. Free silver was especially popular among farmers in the Wheat and the Cotton Belt (the Deep South) as well as silver miners in the West. It had little support among farmers in the Northeast and the Corn Belt (the eastern Midwest).
Free silver became an important issue for Democrats in the presidential elections of 1896 and 1900, although it was twice defeated. Republicans at the time generally preferred the “sound money” of gold (apart from the short-lived Silver Republican Party led by Senator Henry Teller of Colorado), versus Democrats who tended to be more supportive of silver.
According to Wikipedia, the free-silver Populist Party’s subsequent combination with the Democratic Party moved the latter from the support of the gold standard which had been the hallmark of the Cleveland administration to the free-silver position epitomized by 1896 presidential nominee William Jennings Bryan in his Cross of Gold speech. Bryan’s 1896 candidacy was supported by Populists and “silver Republicans” as well as by most Democrats.
The issue was over what would back the US currency. The two options were: gold (wanted by the Goldbugs and William McKinley and silver (wanted by the Silverites and Bryan).
A number of fraternal organizations rose to prominence during the 1890s and supported the silver campaign in 1896, then disappeared after the campaign failed. They included the Freemen’s Protective Silver Association, the Silver Knights of America, and the Patriots of America.
Gold-silver ratio
Gold and silver prices are often compared, to get a sense of which direction each are headed. The gold-silver ratio is the amount of silver one can buy with an ounce of gold. Simply divide the current gold price by the price of silver, to find the ratio.
When gold is over-valued compared to silver, investors take advantage of the arbitrage opportunity, by selling some of their gold holdings to buy silver. The opposite occurs when silver is over-valued compared to gold. In that situation, precious metals investors sell silver to buy gold.
The higher the number, the more undervalued is silver.
On June 12, 2019, the gold-silver ratio hit a 26-year high by breaking through the 90-ounce mark – meaning it took over 90 ounces of silver to purchase one ounce of gold. The higher the number, the more undervalued is silver or, to put it another way, the farther gold is pulling away from silver, valued in dollars per ounce.
The current gold-silver ratio, 74:1, is higher than the historical ratio of 50-60 ounces of silver to one ounce of gold, meaning that silver is somewhat undervalued compared to gold. It means an investor with an ounce of gold could sell his gold for 74 ounces of silver.
Sometimes silver reacts to changes in the price of gold and other times it jumps ahead, but it is almost as if gold pulls silver along with it whether it wants to go or not. As proof, look at a historical silver chart versus gold chart. The pattern in both is very similar.
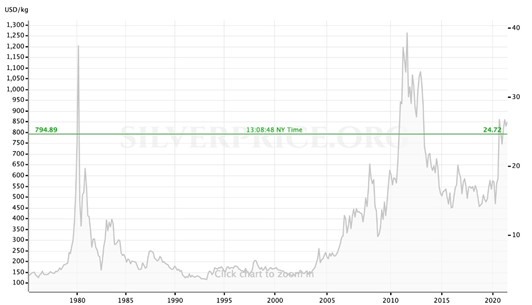
Source: Silverprice.org
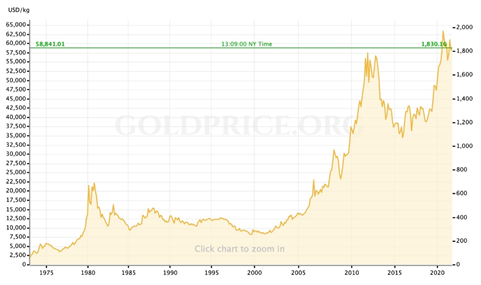
Source: Goldprice.org
Conclusion
As stated at the top, the correlation between gold and silver since 1975 has been 0.8876. The 10-year correlation coefficient is 0.7511. However this year, the correlation has dropped significantly to 0.1959.
Despite the weaker correlation between silver and gold prices this year, only 0.19 compared to the normal 0.88, silver followed gold downward in June, after a US Federal Reserve meeting suggested that the Fed could reduce its $120 billion monthly bond-buying program. Silver mining stocks, particularly producers whose fortunes are closely aligned with the silver price, saw a correction.
They remain deeply undervalued. How undervalued?
Precious metals commentator Adam Hamilton recently crunched the numbers. Analyzing second-quarter earnings from the top 15 silver miners in the leading SIL Global X Silver Miners ETF, Hamilton found that production surged 16.9% year on year, pushing Q2 earnings up by an astounding 472.9%! He writes:
Such incredibly strong earnings in the face of sentiment-battered stock prices have fueled extraordinarily-cheap valuations in some of these silver miners. Out of the 12 companies in the SIL top 15 that have cumulative earnings over this past year, 5 now have trailing-twelve-month price-to-earnings ratios way down in the teens or even single-digits! High-flying silver stocks almost never get this undervalued, it is amazing.
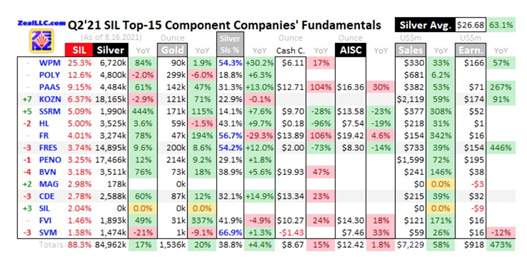
Source: Adam Hamilton, Zeal Intelligence
Risk-tolerant investors stand to benefit even further from lower equity prices, especially those with the mettle and knowledge to invest in juniors, which offer the best leverage to rising commodity prices. Juniors with both copper/ silver projects in their portfolios might be in a position to benefit tremendously.
Richard (Rick) Mills
subscribe to my free newsletter
Ahead of the Herd Facebook
Legal Notice / Disclaimer
Ahead of the Herd newsletter, aheadoftheherd.com, hereafter known as AOTH.
Please read the entire Disclaimer carefully before you use this website or read the newsletter. If you do not agree to all the AOTH/Richard Mills Disclaimer, do not access/read this website/newsletter/article, or any of its pages. By reading/using this AOTH/Richard Mills website/newsletter/article, and whether or not you actually read this Disclaimer, you are deemed to have accepted it.
Any AOTH/Richard Mills document is not, and should not be, construed as an offer to sell or the solicitation of an offer to purchase or subscribe for any investment.
AOTH/Richard Mills has based this document on information obtained from sources he believes to be reliable but which has not been independently verified. AOTH/Richard Mills makes no guarantee, representation or warranty and accepts no responsibility or liability as to its accuracy or completeness. Expressions of opinion are those of AOTH/Richard Mills only and are subject to change without notice. AOTH/Richard Mills assumes no warranty, liability or guarantee for the current relevance, correctness or completeness of any information provided within this Report and will not be held liable for the consequence of reliance upon any opinion or statement contained herein or any omission. Furthermore, AOTH/Richard Mills assumes no liability for any direct or indirect loss or damage or, in particular, for lost profit, which you may incur as a result of the use and existence of the information provided within this AOTH/Richard Mills Report.
AOTH/Richard Mills is not a registered broker/financial advisor and does not hold any licenses. These are solely personal thoughts and opinions about finance and/or investments – no information posted on this site is to be considered investment advice or a recommendation to do anything involving finance or money aside from performing your own due diligence and consulting with your personal registered broker/financial advisor. You agree that by reading AOTH/Richard Mills articles, you are acting at your OWN RISK. In no event should AOTH/Richard Mills liable for any direct or indirect trading losses caused by any information contained in AOTH/Richard Mills articles. Information in AOTH/Richard Mills articles is not an offer to sell or a solicitation of an offer to buy any security. AOTH/Richard Mills is not suggesting the transacting of any financial instruments but does suggest consulting your own registered broker/financial advisor with regards to any such transactions
© 2005-2022 http://www.MarketOracle.co.uk - The Market Oracle is a FREE Daily Financial Markets Analysis & Forecasting online publication.