


Global Stock Markets It’s Do-Or-Die Time
Stock-Markets / Stock Market 2021 Dec 06, 2021 - 03:41 PM GMTBy: Chris_Vermeulen

Almost all of the US and global markets volatility has taken place over the last 6+ trading days. Even though economic data continues to show a strengthening US economy and jobs market, the news of the Omicron COVID variant has spooked the global markets. I’m going to illustrate how the markets are nearing critical support levels that are a “Do-Or-Die” level for the market, in my opinion.
Let’s get right into the charts – shall we?
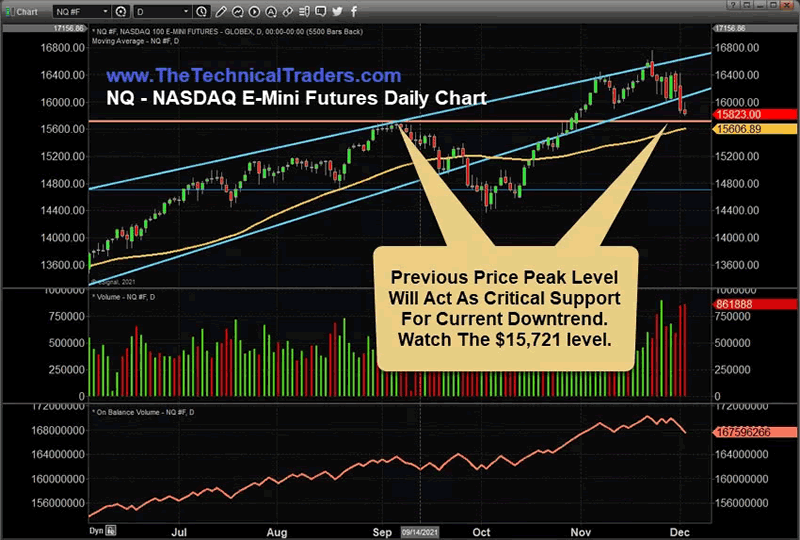
NASDAQ Support Near $15,721 Should Act As A Solid Floor
This NASDAQ chart highlights the orange support level near $15,271 that I believe will act as a HARD FLOOR/SUPPORT for the US markets. We may see $14,750 become the next downside target level if the NQ falls below this level on strong selling. If this support level holds, then I expect the US markets to resume a rally trend and attempt to target $17,000 or higher before the end of 2021.
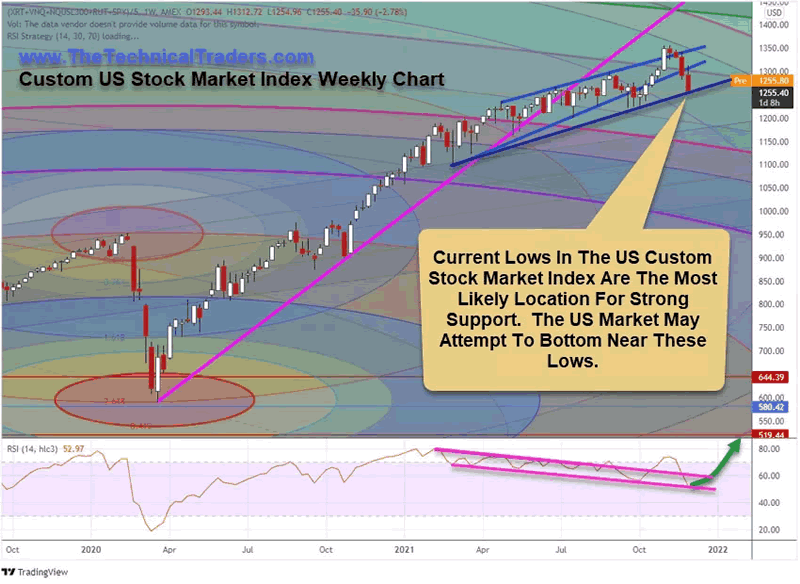
Custom US Stock Market Index Confirms Support Near $15,721
This Custom US Stock Market Weekly Chart highlights the key support channel that originates in early 2021 and spans across recent lows (the DARK BLUE LINE). My opinion is that the alignment of the $15,721 support level from the chart above and this key support channel on the Custom US Stock Market Index chart creates a confluence of critical support. This level becomes a “Do-Or-Die” level for the markets to attempt to bottom and recover going forward.
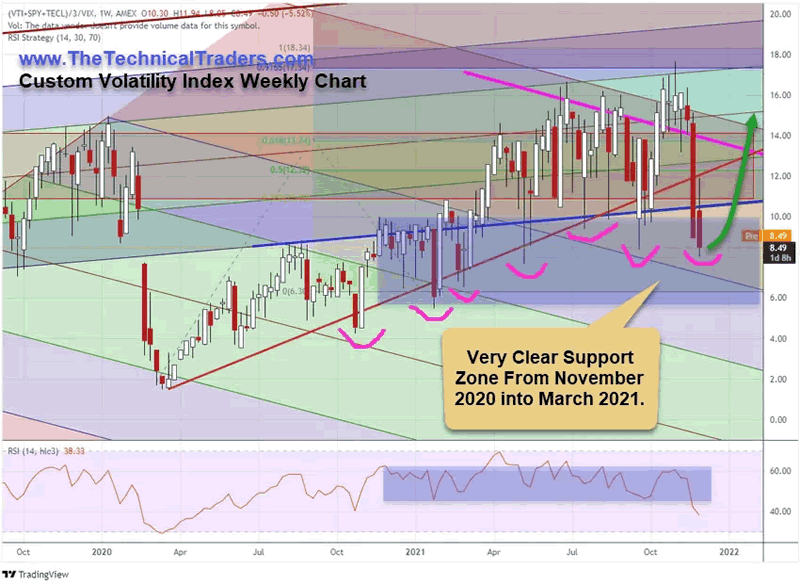
Custom Volatility Index Sets Up A Deep Potential Bottom Level
Lastly, this Weekly Custom Volatility Index chart highlights the multiple deep downside support ranges that have continued to drive future price rallies since the original COVID collapse. The current Custom Volatility Index level is below the last two pullbacks in the US markets and well within the support channel from late 2020 and early 2021.
This Custom Volatility Index would clearly show a breakdown in the US markets by moving below the 6.0 to 6.50 level on strong selling pressure. That is currently not happening, and I suspect the lack of real selling pressure reflects a panic selling mode – not a change in true price trend.
My opinion is the US markets will struggle to hold near recent lows – attempting to hammer out a bottom/base over the next few days. If these critical support levels fail to prompt a bottom in price, we’ll know soon enough. The markets can stay irrational far longer than many people expect.
The next 2 to 5+ trading days should clearly show us if these support levels and channels are solid or not. If the global markets are going to continue to move lower, we should find out soon enough.
Be sure to sign up for our free market trend analysis and signals now so you don’t miss our next special report!
If I’m correct and the markets do hold up near these support channels, we may begin to see a new “Rip-Your-Face-Off” rally phase to start a powerful Santa Rally closing out 2021. That would be incredible to witness and experience.
Watch for support near $15,721 to $15,750 on the NQ over the next 5+ trading days. I believe that level is the “Do-Or-Die” level for the markets going forward.
Curious to Learn More about global markets?
Learn how I use specific tools to help me understand price cycles, set-ups, and price target levels. Over the next 12 to 24+ months, I expect very large price swings in the US stock market and other asset classes across the globe. I believe the markets are beginning to transition away from the continued central bank support rally phase and may start a revaluation phase as global traders attempt to identify the next big trends. Precious Metals will likely begin to act as a proper hedge as caution and concern start to drive traders/investors into Metals.
If you need technically proven trading and investing strategies using ETFs to profit during market rallies and to avoid/profit from market declines, be sure to join me at TEP – Total ETF Portfolio.
Have a great day!
Chris Vermeulen
www.TheTechnicalTraders.com
Chris Vermeulen has been involved in the markets since 1997 and is the founder of Technical Traders Ltd. He is an internationally recognized technical analyst, trader, and is the author of the book: 7 Steps to Win With Logic
Through years of research, trading and helping individual traders around the world. He learned that many traders have great trading ideas, but they lack one thing, they struggle to execute trades in a systematic way for consistent results. Chris helps educate traders with a three-hour video course that can change your trading results for the better.
His mission is to help his clients boost their trading performance while reducing market exposure and portfolio volatility.
He is a regular speaker on HoweStreet.com, and the FinancialSurvivorNetwork radio shows. Chris was also featured on the cover of AmalgaTrader Magazine, and contributes articles to several leading financial hubs like MarketOracle.co.uk
Disclaimer: Nothing in this report should be construed as a solicitation to buy or sell any securities mentioned. Technical Traders Ltd., its owners and the author of this report are not registered broker-dealers or financial advisors. Before investing in any securities, you should consult with your financial advisor and a registered broker-dealer. Never make an investment based solely on what you read in an online or printed report, including this report, especially if the investment involves a small, thinly-traded company that isn’t well known. Technical Traders Ltd. and the author of this report has been paid by Cardiff Energy Corp. In addition, the author owns shares of Cardiff Energy Corp. and would also benefit from volume and price appreciation of its stock. The information provided here within should not be construed as a financial analysis but rather as an advertisement. The author’s views and opinions regarding the companies featured in reports are his own views and are based on information that he has researched independently and has received, which the author assumes to be reliable. Technical Traders Ltd. and the author of this report do not guarantee the accuracy, completeness, or usefulness of any content of this report, nor its fitness for any particular purpose. Lastly, the author does not guarantee that any of the companies mentioned in the reports will perform as expected, and any comparisons made to other companies may not be valid or come into effect.
Chris Vermeulen Archive |
© 2005-2022 http://www.MarketOracle.co.uk - The Market Oracle is a FREE Daily Financial Markets Analysis & Forecasting online publication.