


Fed Interest Rate Actions 1999 to Present – Stock Market What’s Next?
Interest-Rates / Financial Markets 2021 Dec 18, 2021 - 06:03 PM GMTBy: Chris_Vermeulen

Let’s continue to explore the past 20 years of US Fed actions. I believe the US Fed has created a global expansion of both economies and debts/liabilities that may become somewhat painful for foreign nations – and possibly the US.
Reading The Data & What To Expect in 2022 And Beyond
In the first part of this research article, I highlighted the past 25 years of US Fed actions related to the DOT COM bubble, the 9/11 terrorist attack, the 2008-09 US Housing/Credit crisis, and the recent COVID-19 virus event. Each time, the US Federal reserve had attempted to raise interest rates before these crisis events – only to be forced to lower interest rates as the US economy contracted with each unique disruption. The US Fed was taking what it believed were necessary steps to protect the US economy and support the global economy into a recovery period.
Be sure to sign up for our free market trend analysis and signals now so you don’t miss our next special report!
The following few charts highlight the results of the US Fed’s actions to keep interest rates extremely low for most of the past 20 years. I want to highlight what I believe is an excessive credit/debt growth process that has taken place throughout most of the developing world (China, Asia, Africa, Europe, South America, and other nations). At the same time, the US has struggled to regain a functioning growth-based economy absent of US Federal Reserve ZERO interest policies and stimulus.
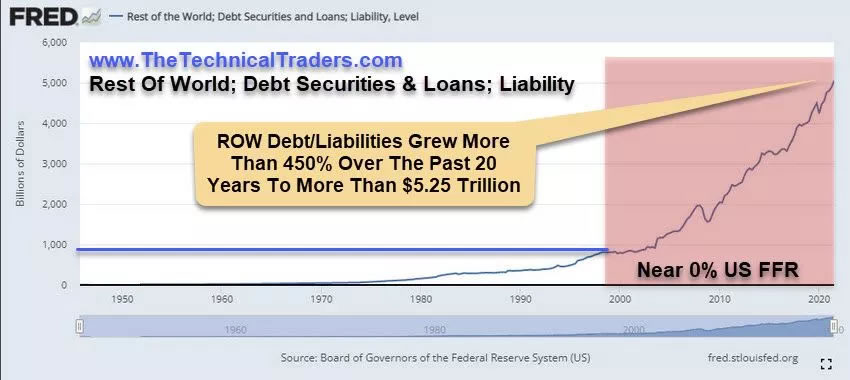
Extreme Growth Of World Debt (excluding the US)
This Rest Of The World; Debt Securities & Loans; Liabilities chart highlights the extreme, almost parabolic, growth in debt and liabilities that have accumulated since 2005-06. If you look closely at this chart, the real increase in debt and leverage related to global growth started to trend higher in 2004-05. During this time, the US housing market was on fire, which likely pushed foreign investors and foreign housing markets to take advantage of this growing trend in US and foreign real estate. This rally in speculative investments, infrastructure, and personal/corporate debt created a huge liability issue throughout many developing nations. Personal and Corporate debt levels are at their highest levels in decades. A recent Reuters article suggests global debt levels have risen in tandem with real estate price levels and is closing in on $300 Trillion in total debt.
(Source: fred.stlouisfed.org)
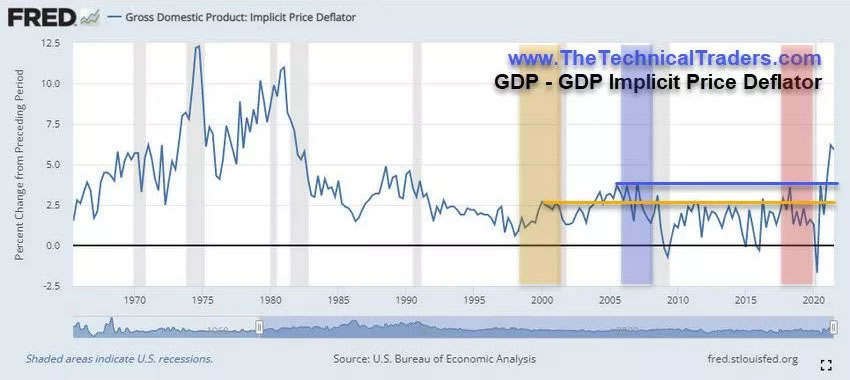
GDP Implicit Price Deflator Rallies To Levels Not Seen Since 1982~83
The rally in the US markets and the incredible rise of inflation over the past 24 months have moved the consumer price levels higher faster than anything we’ve seen over the past 50+ years. We’ve only seen price levels rise at this pace in the 1970s and the early 1980s. These periods reflected a stagflation-like economic period, shortly after the US Fed ended the Gold Standard. This was also a time when the US Federal Reserve moved the Fed Funds Rate up into the 12% to 16% range to combat inflationary trends.
If the GDP Implicit Price Deflator moves above 5.5% over the next few months, the US Fed may be forced to take stronger action to combat these pricing issues and inflationary trends. They have to be cautious not to burst the growth phase of the markets in the process – which could lead to a very large deflationary/deleveraging price trend.
(Source: fred.stlouisfed.org)
We need to focus on how the markets are reacting to these extreme debt/liability trends and extreme price trends. The markets have a natural way of addressing imbalances in supply/demand/pricing functions. The COVID-19 virus event certainly amplified many of these issues throughout the globe by disrupting labor, supply, shipping, and manufacturing for a little more than 12+ months.
The future decisions of the US Federal Reserve will either lead to a much more orderly deleveraging/devaluation process for the US and global markets – supporting the natural economic functions that help to process and remove these excesses. Or, the US Federal Reserve will push interest rates too high, too fast, and topple the fragile balance that is struggling to process the excesses throughout the global markets.
What does this mean?
I believe this data, and all the charts I’ve shared with you in this research article, suggest the US Fed is trapped in a very strenuous position right now. I’ll share more information with you regarding my predictions for December 2021 and 2022 in the third part of this article.
I will also share my proprietary Fed Rate Modeling System’s results in Part III of this article and tell you what I expect from the US Federal Reserve and US stock markets.
Want to learn more about what affects the markets?
Learn how I use specific tools to help me understand price cycles, set-ups, and price target levels. Over the next 12 to 24+ months, I expect very large price swings in the US stock market and other asset classes across the globe. I believe the markets are starting to transition away from the continued central bank support rally phase and may start a revaluation phase as global traders attempt to identify the next big trends. Precious Metals will likely start to act as a proper hedge as caution and concern start to drive traders/investors into Metals.
If you need technically proven trading and investing strategies using ETFs to profit during market rallies and to avoid/profit from market declines, be sure to join me at TEP – Total ETF Portfolio.
Have a great day!
Chris Vermeulen
www.TheTechnicalTraders.com
Chris Vermeulen has been involved in the markets since 1997 and is the founder of Technical Traders Ltd. He is an internationally recognized technical analyst, trader, and is the author of the book: 7 Steps to Win With Logic
Through years of research, trading and helping individual traders around the world. He learned that many traders have great trading ideas, but they lack one thing, they struggle to execute trades in a systematic way for consistent results. Chris helps educate traders with a three-hour video course that can change your trading results for the better.
His mission is to help his clients boost their trading performance while reducing market exposure and portfolio volatility.
He is a regular speaker on HoweStreet.com, and the FinancialSurvivorNetwork radio shows. Chris was also featured on the cover of AmalgaTrader Magazine, and contributes articles to several leading financial hubs like MarketOracle.co.uk
Disclaimer: Nothing in this report should be construed as a solicitation to buy or sell any securities mentioned. Technical Traders Ltd., its owners and the author of this report are not registered broker-dealers or financial advisors. Before investing in any securities, you should consult with your financial advisor and a registered broker-dealer. Never make an investment based solely on what you read in an online or printed report, including this report, especially if the investment involves a small, thinly-traded company that isn’t well known. Technical Traders Ltd. and the author of this report has been paid by Cardiff Energy Corp. In addition, the author owns shares of Cardiff Energy Corp. and would also benefit from volume and price appreciation of its stock. The information provided here within should not be construed as a financial analysis but rather as an advertisement. The author’s views and opinions regarding the companies featured in reports are his own views and are based on information that he has researched independently and has received, which the author assumes to be reliable. Technical Traders Ltd. and the author of this report do not guarantee the accuracy, completeness, or usefulness of any content of this report, nor its fitness for any particular purpose. Lastly, the author does not guarantee that any of the companies mentioned in the reports will perform as expected, and any comparisons made to other companies may not be valid or come into effect.
Chris Vermeulen Archive |
© 2005-2022 http://www.MarketOracle.co.uk - The Market Oracle is a FREE Daily Financial Markets Analysis & Forecasting online publication.