


Effect of Deflation On The Gold Price
Commodities / Gold and Silver 2022 Jan 07, 2022 - 09:26 PM GMTBy: Kelsey_Williams

The higher price for gold over time reflects the loss in purchasing power of the US dollar. The loss in the dollar’s purchasing power is an effect of inflation.
Over the past century, the US dollar has lost approximately ninety-nine percent of its purchasing power. The loss in purchasing power is reflected in a gold price that has increased one-hundred fold ($20.67 oz. x 100 = $2067 oz).
The effect of deflation on the gold price is different. To be more accurate, the effect of deflation on gold’s price is opposite to the effect resulting from inflation.
Deflation is characterized by a contraction in the supply of money. Hence, each remaining unit is more valuable; i.e. its purchasing power increases.
There is probably no better example of deflation than that which happened in the United States and the rest of the world in the 1930s – The Great Depression.
A huge contraction in the supply of money and credit led to financial and economic collapse. As per the definition of deflation above, there were considerably fewer dollars in circulation. The purchasing power of those dollars increased quite measurably.
During the depression, many people did not have much money. But the dollars they did have would actually purchase more, not less.
Prices for ordinary goods and services declined by twenty-five percent during the three years ending in 1932. This was in addition to an approximately ten percent decline that had occurred over the course of the 1920s.
With each dollar buying as much as 1/3 more than just a few years earlier, and with a stock market that had dropped by as much as ninety percent, inflation wasn’t a concern.
All during this time the price of gold was fixed was fixed at $20.67 oz. and convertible with the US dollar. Twenty US paper dollars were exchangeable for one ounce of gold and vice versa.
SOME CHARTS AND HISTORICAL EXAMPLES
Below is a chart (source) showing the gold price history for the period during which its price was fixed…
Gold Prices – Historical Chart
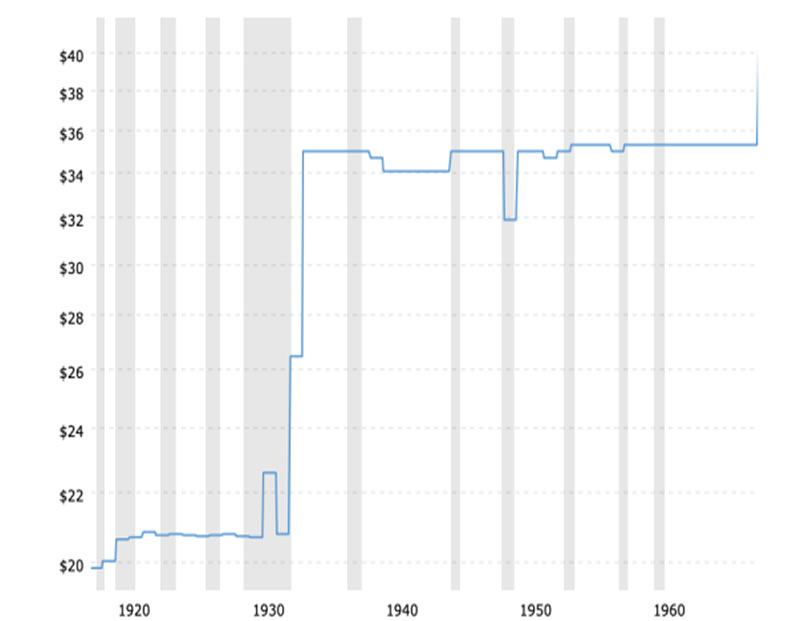
The vertical leap upwards from $ 20.67 to $35.00 is accounted for thusly…
“In 1933, President Franklin Roosevelt issued an executive order prohibiting private ownership of gold by U.S. citizens and revaluing gold at $35.00 to the ounce. Also, U.S. paper currency would no longer be convertible into gold for U.S. citizens. Foreign holders (primarily foreign governments) could continue to redeem their holdings of U.S. dollars for gold at the “new, official” rate of $35.00 to the ounce.” (see A Loaf Of Bread, A Gallon Of Gas, A Ounce Of Gold)
After that, the gold price remained fixed at $35.00 oz for nearly four decades. This is shown on the chart above.
With that in mind, here is another chart (source) for the same period of time. It shows the gold price in inflation-adjusted terms…
Gold Prices (inflation-adjusted) Historical Chart
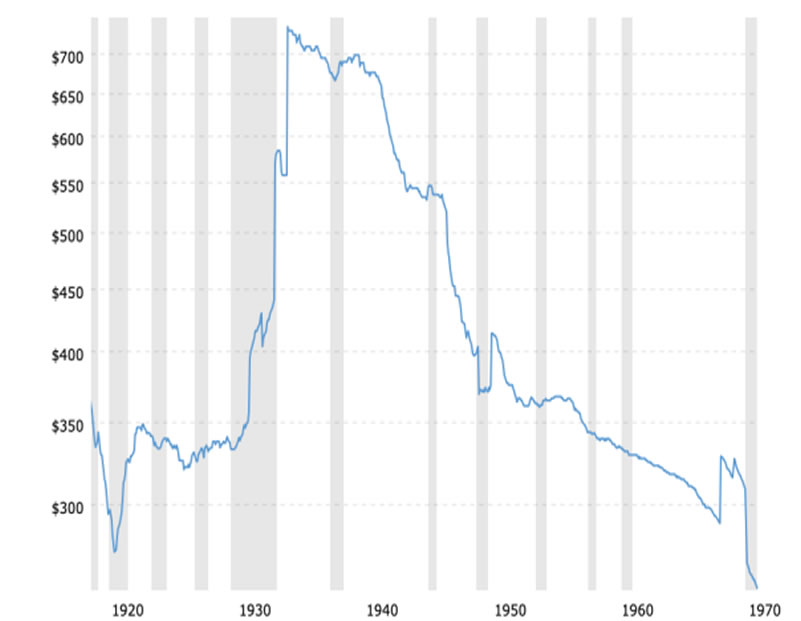
Beginning in January 1934 and ending in November 1970 the purchasing power of an ounce of gold dropped by sixty-five percent. This is a reflection of the deflation that had previously occurred and which showed up in a US dollar which had grown stronger, not weaker. (Remember, this happened even though the nominal price of gold was fixed at $35 oz.)
There were fewer dollars in circulation and they were worth more – not less. As a result, US dollars were, at least for the time being, more valuable than gold.
WHAT TO EXPECT FROM GOLD NOW
Could something similar happen today? Yes. In fact, it may already be happening. See the chart below…
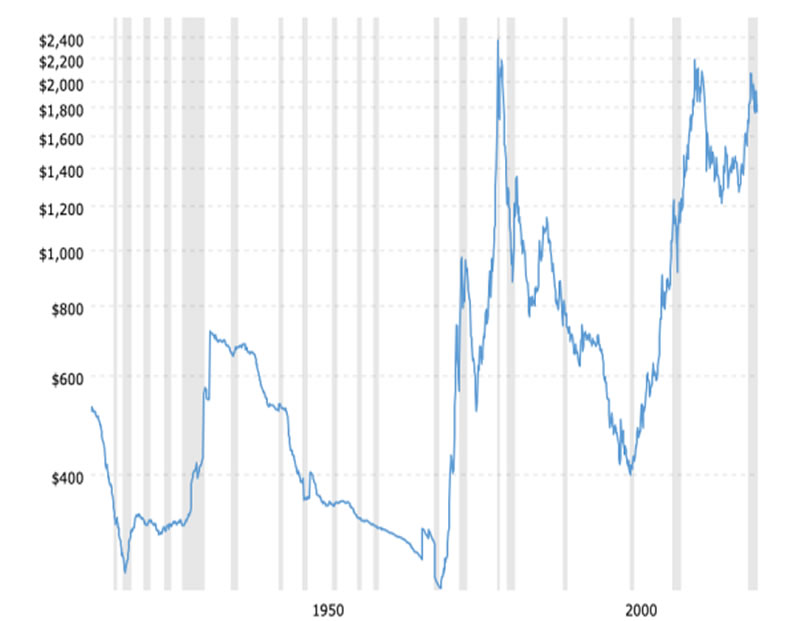
Inflation-adjusted peaks in the gold price in 1934, 1980, and 2011 were followed by multi-year drops of 65%, 83%, and 41%. A simple average of those three drops is 63%.
A drop of 63% from the inflation-adjusted peak in 2020 would take gold down to approximately $800 oz.
Kelsey Williams is the author of two books: INFLATION, WHAT IT IS, WHAT IT ISN’T, AND WHO’S RESPONSIBLE FOR IT and ALL HAIL THE FED!
By Kelsey Williams
http://www.kelseywilliamsgold.com
Kelsey Williams is a retired financial professional living in Southern Utah. His website, Kelsey’s Gold Facts, contains self-authored articles written for the purpose of educating others about Gold within an historical context.
© 2021 Copyright Kelsey Williams - All Rights Reserved Disclaimer: The above is a matter of opinion provided for general information purposes only and is not intended as investment advice. Information and analysis above are derived from sources and utilising methods believed to be reliable, but we cannot accept responsibility for any losses you may incur as a result of this analysis. Individuals should consult with their personal financial advisors.
© 2005-2022 http://www.MarketOracle.co.uk - The Market Oracle is a FREE Daily Financial Markets Analysis & Forecasting online publication.