


Volatility Retreats As Stocks & Commodities Rally
Stock-Markets / Financial Markets 2022 Mar 28, 2022 - 10:20 PM GMTBy: Chris_Vermeulen

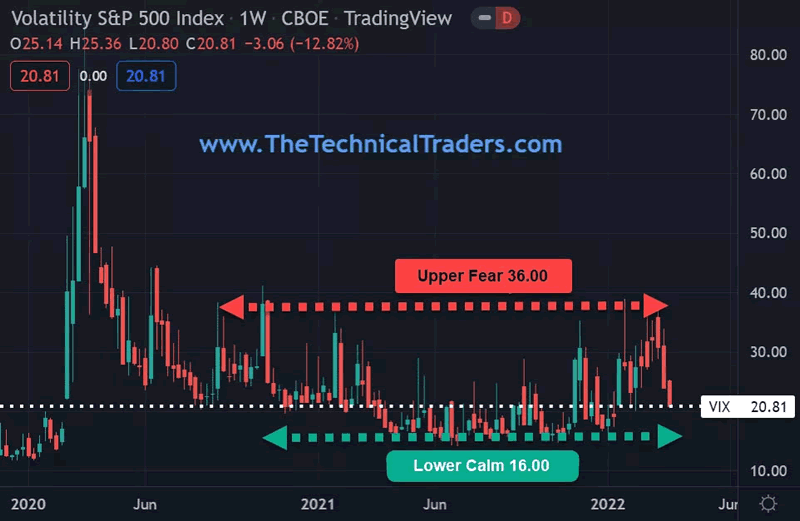
The CBOE Volatility Index (VIX) is a real-time index. It is derived from the prices of SPX index options with near-term expiration dates that are utilized to generate a 30-day forward projection of volatility. The VIX allows us to gauge market sentiment or the degree of fear among market participants. As the Volatility Index VIX goes up, fear increases, and as it goes down, fear dissipates.
Commodities and equities are both showing renewed strength on the heels of global interest rate increases. Inflation shows no sign of abating as energy, metals, food products, and housing continues their upward bias.
During the last 18-months, the VIX has been trading between its upper resistance of 36.00 and its lower support of 16.00. As the Volatility Index VIX falls, fear subsides, and money flows back into stocks.
VIX – VOLATILITY S&P 500 INDEX – CBOE – DAILY CHART
SPY RALLIES +10%
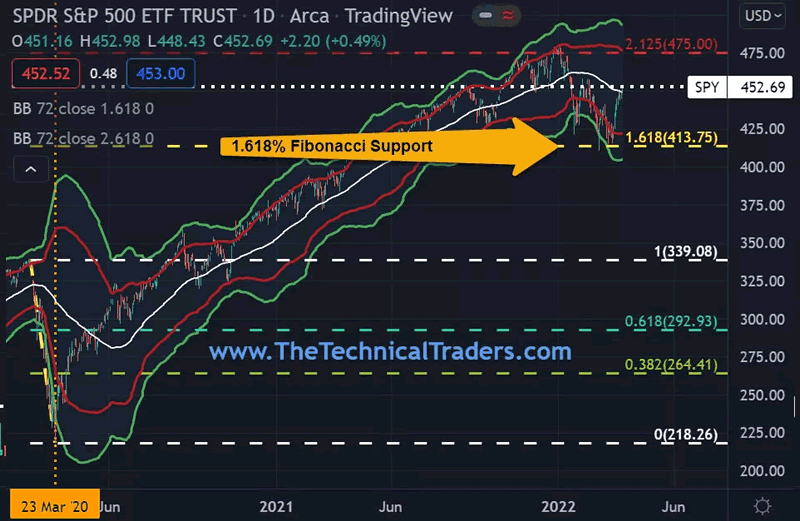
The SPY has enjoyed a sharp rally back up after touching its Fibonacci 1.618% support based on its 2020 Covid price drop. Money has been flowing back into stocks as investors seem to be adapting to the current geopolitical environment and the change in global central bank lending rate policy.
Resistance on the SPY is the early January high near 475, while support remains solidly in place at 414. March marks the 2nd anniversary of the 2020 Covid low that SPY made at 218.26 on March 23, 2020.
SPY – SPDR S&P 500 ETF TRUST – ARCA – DAILY CHART
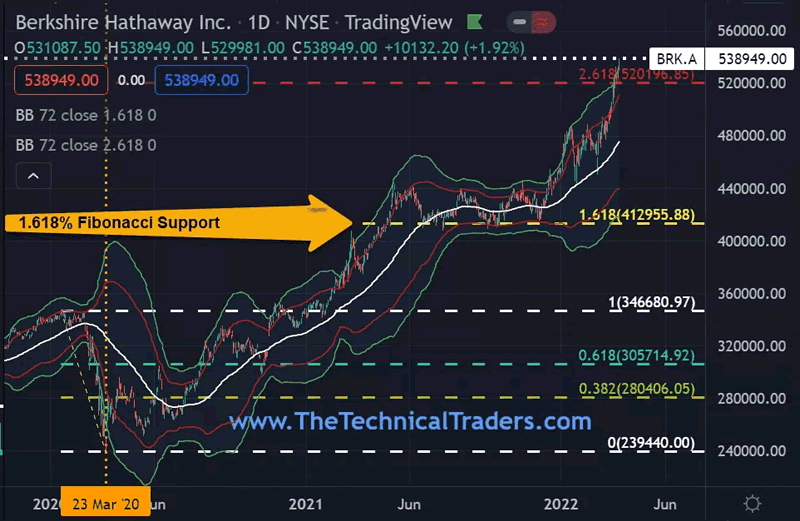
BERKSHIRE HATHAWAY RECORD-HIGH $538,949!
Berkshire Hathaway is up +20.01% year to date compared to the S&P 500 -4.68%. Berkshire’s Warren Buffet has also been on a shopping spree, and investors seem to be comforted that he is buying stocks again. Buffet reached a deal to buy insurer Alleghany (y) for $11.6 billion and purchased nearly a 15% stake in Occidental Petroleum (OXY), worth $8 billion.
These acquisitions seem to be well-timed as insurers and banks tend to benefit from rising interest rates, and Occidental generates the bulk of its cash flow from the production of crude oil.
As technical traders, we look exclusively at the price action to provide specific clues as to the current trend or a potential change in trend. With that said, Berkshire is a classic example of not fighting the market. As Berkshire continues to make new highs, its’ trend is up!
BRK.A – BERKSHIRE HATHAWAY INC. – NYSE – DAILY CHART
COMMODITY DEMAND REMAINS STRONG
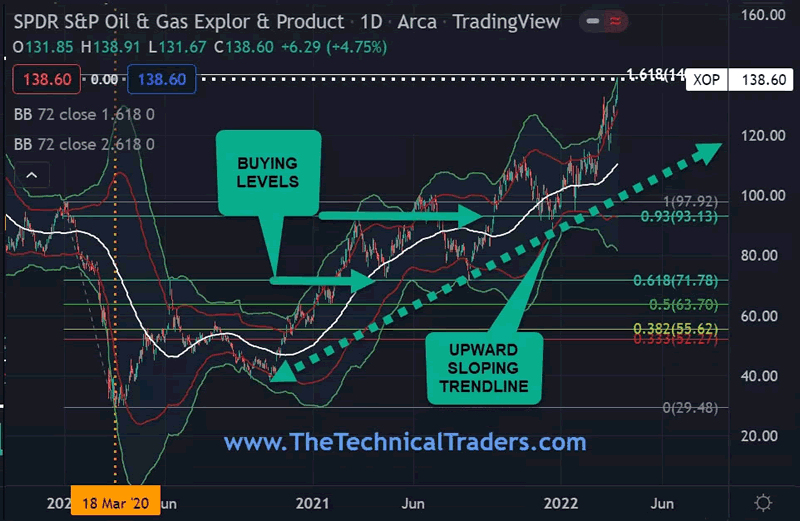
Inflation continues to run at 40-year highs, and it appears that it will take more than one FED rate hike to subdue prices. Since price is King, we definitely want to ride this trend and not fight it. It is always nice to buy on a pullback, but the energy markets at this point appear to be rising exponentially. The XOP ETF gave us some nice buying opportunities earlier at the Fibonacci 0.618% $71.78 and the 0.93% $93.13 of the COVID 2020 range high-low.
Remember, the trend is your friend, as many a trader has gone broke trying to pick or sell a top before its time! Well-established uptrends like the XOP are perfect examples of how utilizing a trailing stop can keep a trader from getting out of the market too soon but still offer protection in case of a sudden trend reversal.
XOP – SPDR S&P OIL & GAS EXPLORE & PRODUCT – ARCA – DAILY CHART
KNOWLEDGE, WISDOM, AND APPLICATION ARE NEEDED
It is important to understand that we are not saying the market has topped and is headed lower. This article is to shed light on some interesting analyses of which you should be aware. As technical traders, we follow price only, and when a new trend has been confirmed, we will change our positions accordingly. We provide our ETF trades to our subscribers, and somewhat surprisingly, we entered five new trades last week, four of which have now hit their first profit target levels. Our models continually track price action in a multitude of markets, asset classes, and global money flow. As our models generate new information about trends or a change in trends, we will communicate these signals expeditiously to our subscribers and to those on our trading newsletter email list.
Sign up for my free trading newsletter so you don’t miss the next opportunity
Furthermore, successfully trading is not limited to when to buy or sell stocks or commodities. Money and risk management play a critical role in becoming a consistently profitable trader. Correct position sizing utilizing stop-loss orders helps preserve your investment capital and allows traders to manage their portfolios according to their desired risk parameters. Additionally, scaling out of positions by taking profits and moving stop-loss orders to breakeven can complement ones’ success.
WHAT STRATEGIES CAN HELP YOU NAVIGATE The CURRENT MARKET TRENDS with US and CHINA STOCKS?
Learn how I use specific tools to help me understand price cycles, set-ups, and price target levels in various sectors to identify strategic entry and exit points for trades. Over the next 12 to 24 months, I expect very large price swings in the US stock market and other asset classes across the globe. I believe we are seeing the markets beginning to transition away from the continued central bank support rally phase and have started a revaluation phase as global traders attempt to identify the next big trends. Precious Metals will likely start to act as a proper hedge as caution and concern start to drive traders/investors into metals, commodities, and other safe-havens.
UNDERSTAND HOW TO NAVIGATE OUR VOLATILE MARKETS!
GET READY, GET SET, GO -I invite you to learn more about how my three ETF Technical Trading Strategies can help you protect and grow your wealth in any type of market condition by clicking on the following link: www.TheTechnicalTraders.com
Have a great day!
Chris Vermeulen
www.TheTechnicalTraders.com
Chris Vermeulen has been involved in the markets since 1997 and is the founder of Technical Traders Ltd. He is an internationally recognized technical analyst, trader, and is the author of the book: 7 Steps to Win With Logic
Through years of research, trading and helping individual traders around the world. He learned that many traders have great trading ideas, but they lack one thing, they struggle to execute trades in a systematic way for consistent results. Chris helps educate traders with a three-hour video course that can change your trading results for the better.
His mission is to help his clients boost their trading performance while reducing market exposure and portfolio volatility.
He is a regular speaker on HoweStreet.com, and the FinancialSurvivorNetwork radio shows. Chris was also featured on the cover of AmalgaTrader Magazine, and contributes articles to several leading financial hubs like MarketOracle.co.uk
Disclaimer: Nothing in this report should be construed as a solicitation to buy or sell any securities mentioned. Technical Traders Ltd., its owners and the author of this report are not registered broker-dealers or financial advisors. Before investing in any securities, you should consult with your financial advisor and a registered broker-dealer. Never make an investment based solely on what you read in an online or printed report, including this report, especially if the investment involves a small, thinly-traded company that isn’t well known. Technical Traders Ltd. and the author of this report has been paid by Cardiff Energy Corp. In addition, the author owns shares of Cardiff Energy Corp. and would also benefit from volume and price appreciation of its stock. The information provided here within should not be construed as a financial analysis but rather as an advertisement. The author’s views and opinions regarding the companies featured in reports are his own views and are based on information that he has researched independently and has received, which the author assumes to be reliable. Technical Traders Ltd. and the author of this report do not guarantee the accuracy, completeness, or usefulness of any content of this report, nor its fitness for any particular purpose. Lastly, the author does not guarantee that any of the companies mentioned in the reports will perform as expected, and any comparisons made to other companies may not be valid or come into effect.
Chris Vermeulen Archive |
© 2005-2022 http://www.MarketOracle.co.uk - The Market Oracle is a FREE Daily Financial Markets Analysis & Forecasting online publication.