


Can Tracking Global Money Flow Provide Clues To Stay In The Black?
Stock-Markets / Financial Crisis 2022 Apr 01, 2022 - 04:08 PM GMTBy: Chris_Vermeulen

According to The Bank of International Settlements, the global foreign currency exchange (FX) daily transactional turnover averages $6.6 trillion. At Technical Traders, we track a variety of markets, asset classes, and global money flow looking for clues that will help us in our quest for ETF returns. Interestingly when foreign exchange is charted as a benchmark to the SPY (S&P 500), we can see that FX has also been in a risk-on environment for the past 2-years.
Recently we looked at volatility utilizing the CBOE Volatility Index known as VIX. But there are alternative ways or tools that we can use to analyze asset prices.
GLOBAL MONEY FLOW HAS BEEN RISK-ON
As seen in energy, metals, food commodities, and real estate, the recent surge in inflation has also been taking place in foreign exchange. Commodity currencies typically refer to the Australian, New Zealand, and Canadian dollar. To a certain extent, the U.S. dollar as well due to its global ranking as one of the top producers of worldwide oil and gas.
Typically, a currency like the Australian dollar will experience global money in-flows in a risk-on environment. Whereas in a risk-off environment, the opposite occurs as money flows out of currencies like the Australian dollar and back into what are considered safe-haven currencies like the Swiss franc, Japanese yen, and the U.S. dollar.
Recently money has been re-allocating to different assets as global investors seek returns. The FX markets have also benefited from capital in-flows. Looking at the last 2-years, beginning from the Covid lows put in on March 2020, we see the SPY went from a -30% loss to early January, where the SPY touched +50%.
Interestingly, the AUDJPY (Australian dollar vs. Japanese yen) went from -15% to more than +20% or a total change of 35% during the same timeframe. But how do we utilize this information to determine where we are in the current market cycle? Let’s walk through this process together to see what clues the FX market may have to guide our ETF selection and trading.
AUDJPY VS SPY – DAILY CHART
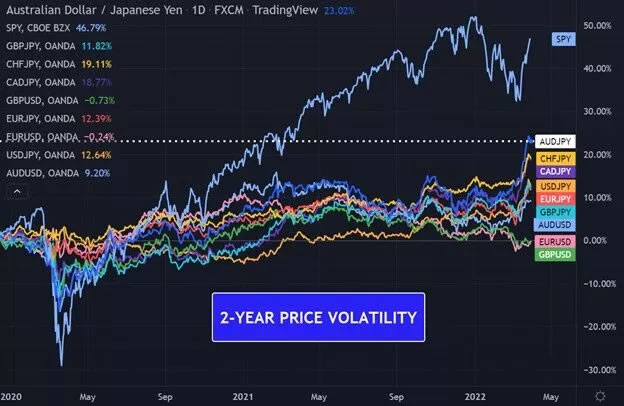
www.TheTechnicalTraders.com – TradingView
GBPJPY REACTS TO 6-YEAR UPPER CHANNEL RESISTANCE
Based on the historical analysis, the GBPJPY (British pound vs. Japanese yen) tends to track the SPY, and therefore we will do a quick breakdown of the GBPJPY.
Immediately we can see on the following monthly chart that the GBPJPY reacts nicely to its 72-month or 6-year upper and lower channel. In 2011 the GBPJPY made a low and turned up at its 6-year lower channel.
During the 2015 to 2016 time frame, the GBPJPY then put in a head and shoulders top formation over a 12-month period at the 6-year upper channel. It’s important to note that the head of the top was at 166.6% of the GBPJPY all-time low in the GBPJPY, and the shoulders were made at the Fibonacci 161.8% of the GBPJPY all-time low.
The 2016 drop was 17-months down, and the 2017 reaction back up was 17-months up. The 2019-20 drop was 26-months down, and to date, the 2020-21 move back up has just completed 26-months up. Note: indicator includes or counts both the low-month and the high-month in its counts. The main point here is that the GBPJPY, in its recent past, has been mirroring its previous price wave.
Both 2016 and 2017 lows were made at 50% of the GBPJPY all-time high. But the 2020 low also turned at the 6-year lower channel.
Now we find the GBPJPY currently reacting to its 6-year upper channel after booking a 26-bar (month) rally.
It is important to note that this article is written to give us insights into some alternative research to challenge us to find clues in price. Time will provide confirmation of this research or not, but if the price continues to react at these levels, we may need to consider that market psychology or trend may be beginning to shift.
GBPJPY – BRITISH POUND VS JAPANESE YEN – MONTHLY CHART
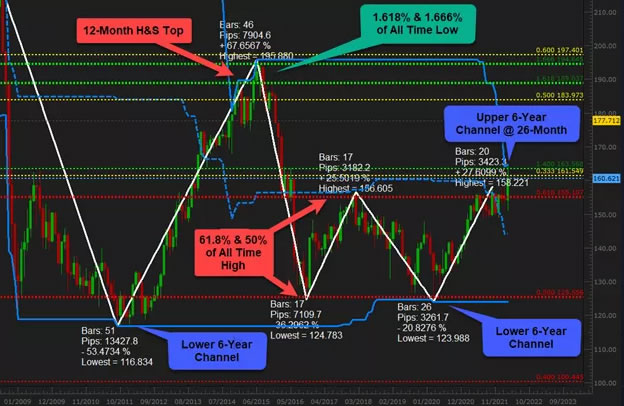
www.TheTechnicalTraders.com: GBPJPY – Daily Chart – FXCM Trading Station
LEARN HOW TO USE PRICE TO DETERMINE TREND
As technical traders, we follow price only, and when a new trend has been confirmed, we will change our positions accordingly. We provide our ETF trades to our subscribers. Somewhat surprisingly, we entered five new trades last week, four of which have now hit their first profit target levels and two of which have now been closed at a profit. Our models continually track price action in a multitude of markets, asset classes, and global money flow. As our models generate new information about trends or a change in trends, we will communicate these signals expeditiously to our subscribers and to those on our trading newsletter email list.
Sign up for my free trading newsletter so you don’t miss the next opportunity
Being successful at trading is more than knowing when to buy or sell. Money and risk management play a critical role in becoming a consistently profitable trader. Correct position sizing along with the utilization of stop-loss orders can help preserve your valuable investment capital. Taking profits in stages by scaling out of positions and when appropriate moving stop-loss orders to breakeven can further boost your trading performance with the benefit of reducing your portfolio risk.
WHAT STRATEGIES CAN HELP YOU NAVIGATE The CURRENT MARKET TRENDS with US and CHINA STOCKS?
Learn how I use specific tools to help me understand price cycles, set-ups, and price target levels in various sectors to identify strategic entry and exit points for trades. Over the next 12 to 24 months, I expect very large price swings in the US stock market and other asset classes across the globe. I believe we are seeing the markets beginning to transition away from the continued central bank support rally phase and have started a revaluation phase as global traders attempt to identify the next big trends. Precious Metals will likely start to act as a proper hedge as caution and concern start to drive traders/investors into metals, commodities, and other safe-havens.
UNDERSTAND HOW TO NAVIGATE OUR VOLATILE MARKETS!
GET READY, GET SET, GO -I invite you to learn more about how my three ETF Technical Trading Strategies can help you protect and grow your wealth in any type of market condition by clicking on the following link: www.TheTechnicalTraders.com
Have a great day!
Chris Vermeulen
www.TheTechnicalTraders.com
Chris Vermeulen has been involved in the markets since 1997 and is the founder of Technical Traders Ltd. He is an internationally recognized technical analyst, trader, and is the author of the book: 7 Steps to Win With Logic
Through years of research, trading and helping individual traders around the world. He learned that many traders have great trading ideas, but they lack one thing, they struggle to execute trades in a systematic way for consistent results. Chris helps educate traders with a three-hour video course that can change your trading results for the better.
His mission is to help his clients boost their trading performance while reducing market exposure and portfolio volatility.
He is a regular speaker on HoweStreet.com, and the FinancialSurvivorNetwork radio shows. Chris was also featured on the cover of AmalgaTrader Magazine, and contributes articles to several leading financial hubs like MarketOracle.co.uk
Disclaimer: Nothing in this report should be construed as a solicitation to buy or sell any securities mentioned. Technical Traders Ltd., its owners and the author of this report are not registered broker-dealers or financial advisors. Before investing in any securities, you should consult with your financial advisor and a registered broker-dealer. Never make an investment based solely on what you read in an online or printed report, including this report, especially if the investment involves a small, thinly-traded company that isn’t well known. Technical Traders Ltd. and the author of this report has been paid by Cardiff Energy Corp. In addition, the author owns shares of Cardiff Energy Corp. and would also benefit from volume and price appreciation of its stock. The information provided here within should not be construed as a financial analysis but rather as an advertisement. The author’s views and opinions regarding the companies featured in reports are his own views and are based on information that he has researched independently and has received, which the author assumes to be reliable. Technical Traders Ltd. and the author of this report do not guarantee the accuracy, completeness, or usefulness of any content of this report, nor its fitness for any particular purpose. Lastly, the author does not guarantee that any of the companies mentioned in the reports will perform as expected, and any comparisons made to other companies may not be valid or come into effect.
Chris Vermeulen Archive |
© 2005-2022 http://www.MarketOracle.co.uk - The Market Oracle is a FREE Daily Financial Markets Analysis & Forecasting online publication.