


NASDAQ 100 Stock Market LOWER LOWS & LOWER HIGH
Stock-Markets / Tech Stocks May 16, 2022 - 04:01 PM GMTBy: Chris_Vermeulen

Following and trading on price can be compared to the reading of a good book. As we read each page, we acquire additional information that may give us a better understanding of the unfolding story.
The same is true of the market, as each day is like the reading of another page. The pages of a book make up chapters. These chapters in trading represent bull markets, bear markets, distribution and accumulation, and time frames of high and low volatility.
Unfortunately, in trading, we cannot skip to the end of the book to learn how everything turns out. However, as traders, we have learned that studying and remembering the past can pay great dividends.
Trading price in its rawest form is simply plotting and studying price without the use of moving averages, stochastics, RSI, or other technical indicators. This simplified but often overlooked methodology can offer everything a trader needs to be successful.
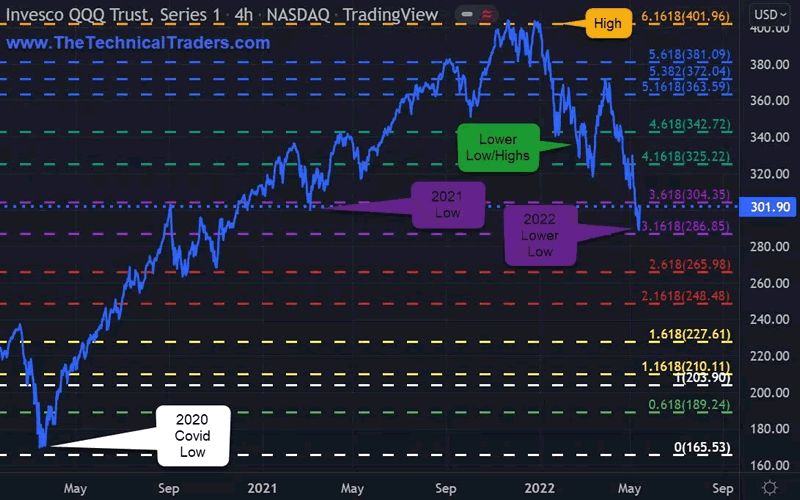
NASDAQ 100 LOWER LOWS & LOWER HIGH
QQQ – The Nasdaq 100 ETF has been making lower lows and lower highs. A longer-term analysis of price is showing us that the 2022 low is lower than the lowest price that the QQQ had traded in 2021. The QQQ in 2021 had a peak to trough range of 26.03%. So far in 2022, the QQQ has had a peak to trough range of 28.71%.
Therefore: Price is showing that QQQ is breaking down and volatility is expanding as it is greater than last year.
QQQ • INVESCO QQQ TRUST ETF • NASDAQ • 4-HOUR
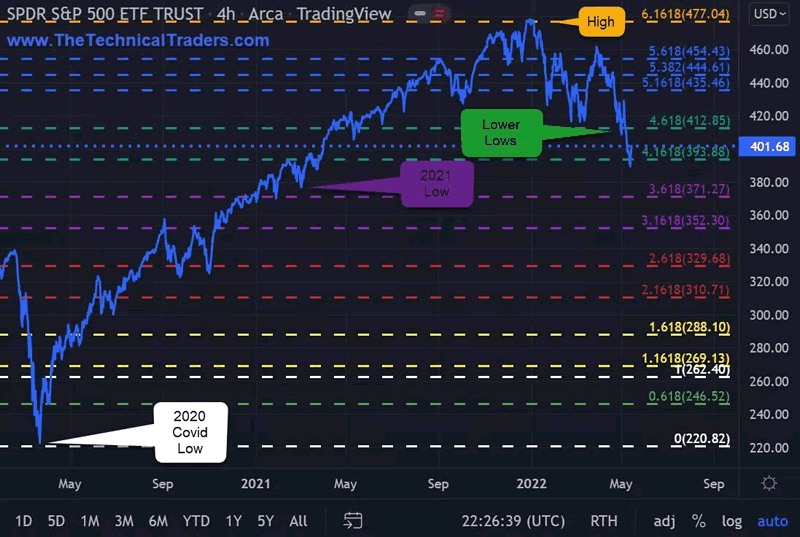
S&P 500 LOWER LOWS & LOWER HIGHS
SPY – The S&P 500 ETF has been making lower lows and lower highs. The SPY in 2022 has had a peak to trough range of 18.74%.
Therefore: Price is showing us SPY is breaking down and it appears to have put in a major top with confirmation being a new swing low.
SPY • SPDR S&P 500 ETR TRUST • ARCA • 4-HOUR
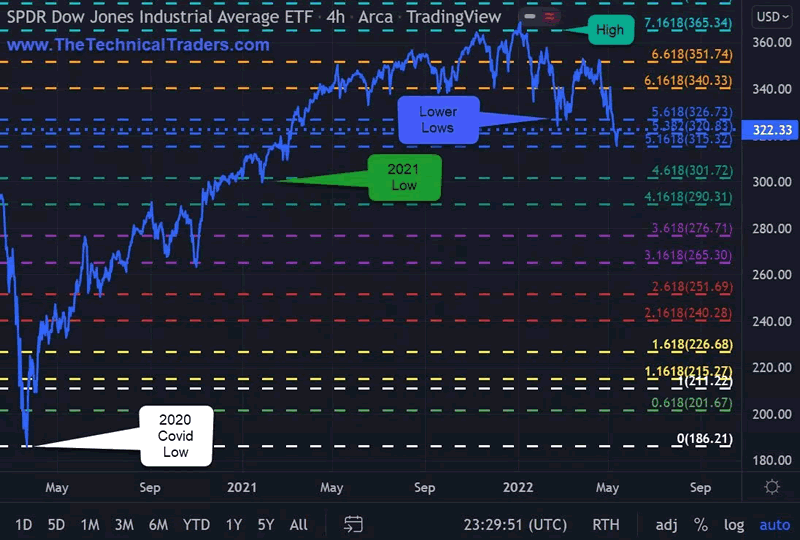
DOW 30 LOWER LOWS & LOWER HIGHS
DIA – The Dow Jones Industrials 30 ETF has been making lower lows and lower highs. The DIA in 2022 has had a peak to trough range of 15.02%.
Therefore: Price is showing us DIA is breaking down and appears to have put in a major top with confirmation being a new swing low.
Note: the DIA is doing better than the QQQ or SPY as money flow is rotating out of previously high-performing stocks and seeking safety in blue-chip lower performing stocks.
DIA • SPDR DOW JONES INDUSTRIAL AVERAGE ETF •ARCA • 4-HOUR
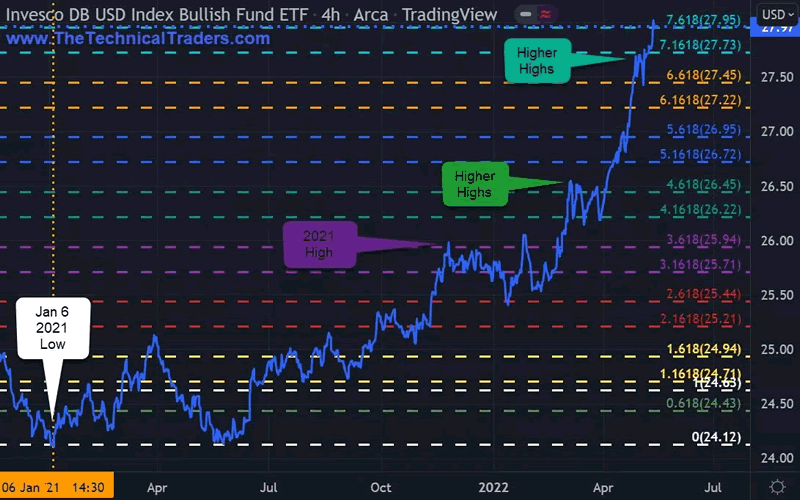
US DOLLAR HIGHER HIGHS & HIGHER LOWS
UUP – The US Dollar ETF has been making higher highs and higher lows. The UUP in 2022 has had a peak to trough range of 10.43%. UUP has also taken out the highest high that it made in 2021.
Therefore: The price is showing us UUP has broken out to the upside and is in a bull market with confirmation being a new swing high.
According to the 2019 Triennial Central Bank Survey conducted every three years by the Bank of International Settlements: trading in FX markets reached $6.6 trillion per day in April 2019. The BIS report further noted the USD is associated with 88% of all trades, which is $5.8+ trillion in USD daily transactional volume.
The US Dollar continues to attract capital from investors all over the world. But this may prove to be a double-edged sword for US stocks. As capital flocks to the USD, this, in turn, hurts US multinationals as they need to convert their weak foreign currency profits back into USD.
The USD safe-haven trade may eventually trigger a broad and deep selloff in US stocks. As the USD continues to strengthen, corporate profits for US multinationals will shrink or disappear.
UUP • INVESCO DB USD INDEX BULLISH FUND ETF • ARCA • 4-HOUR
LEARN FROM OUR TEAM OF SEASONED TRADERS
In today’s market environment, it’s imperative to assess your trading plan, portfolio holdings, and cash reserves. Experienced traders know what their downside risk is and adapt as necessary. Successful traders manage risk by utilizing stop-loss orders, rebalancing existing positions, reducing portfolio holdings, liquidating investments, and moving into cash.
Successfully managing our drawdowns ensures our trading success. The larger the loss, the more difficult it will be to make up. Consider the following:
- A loss of 10% requires an 11% gain to recover
- A 50% loss requires a 100% gain to recover
- A 60% loss requires an even more daunting 150% gain to simply return to break even.
Recovery time also varies significantly depending upon the magnitude of the drawdown. A 10% drawdown can typically be recovered in weeks or a few months, while a 50% drawdown may take several years to recover.
Depending on a trader’s age, they may not have the time to wait on the recovery or the patience. Therefore, successful traders know it’s critical to keep their drawdowns within reason, as most of them learned this principle the hard way.
HOW WE CAN HELP YOU LEARN TO INVEST CONSERVATIVELY
At TheTechnicalTraders.com, my team and I can do these things:
- Reduce your FOMO and manage your emotions.
- Have proven trading strategies for bull and bear markets.
- Provide quality trades for investing conservatively.
- Tell you when to take profits and exit trades.
- Save you time with our research.
- Provide above-average returns/growth over the long run.
- Have consistent growth with low volatility/risks.
- Make trading and investing safer, more profitable, and educational.
Sign up for my free trading newsletter so you don’t miss the next opportunity!
We invite you to join our group of active traders and investors to learn and profit from our three ETF Technical Trading Strategies. We can help you protect and grow your wealth in any type of market condition by clicking on the following link: www.TheTechnicalTraders.com
Have a great day!
Chris Vermeulen
www.TheTechnicalTraders.com
Chris Vermeulen has been involved in the markets since 1997 and is the founder of Technical Traders Ltd. He is an internationally recognized technical analyst, trader, and is the author of the book: 7 Steps to Win With Logic
Through years of research, trading and helping individual traders around the world. He learned that many traders have great trading ideas, but they lack one thing, they struggle to execute trades in a systematic way for consistent results. Chris helps educate traders with a three-hour video course that can change your trading results for the better.
His mission is to help his clients boost their trading performance while reducing market exposure and portfolio volatility.
He is a regular speaker on HoweStreet.com, and the FinancialSurvivorNetwork radio shows. Chris was also featured on the cover of AmalgaTrader Magazine, and contributes articles to several leading financial hubs like MarketOracle.co.uk
Disclaimer: Nothing in this report should be construed as a solicitation to buy or sell any securities mentioned. Technical Traders Ltd., its owners and the author of this report are not registered broker-dealers or financial advisors. Before investing in any securities, you should consult with your financial advisor and a registered broker-dealer. Never make an investment based solely on what you read in an online or printed report, including this report, especially if the investment involves a small, thinly-traded company that isn’t well known. Technical Traders Ltd. and the author of this report has been paid by Cardiff Energy Corp. In addition, the author owns shares of Cardiff Energy Corp. and would also benefit from volume and price appreciation of its stock. The information provided here within should not be construed as a financial analysis but rather as an advertisement. The author’s views and opinions regarding the companies featured in reports are his own views and are based on information that he has researched independently and has received, which the author assumes to be reliable. Technical Traders Ltd. and the author of this report do not guarantee the accuracy, completeness, or usefulness of any content of this report, nor its fitness for any particular purpose. Lastly, the author does not guarantee that any of the companies mentioned in the reports will perform as expected, and any comparisons made to other companies may not be valid or come into effect.
Chris Vermeulen Archive |
© 2005-2022 http://www.MarketOracle.co.uk - The Market Oracle is a FREE Daily Financial Markets Analysis & Forecasting online publication.