


Stocks Bear Market Worst is Likely Behind Us
Stock-Markets / Stocks Bear Market Oct 31, 2008 - 12:55 PM GMTBy: John_Derrick

 To get some perspective on the current market conditions, it may be helpful to look at what some bear markets of the past have looked like.
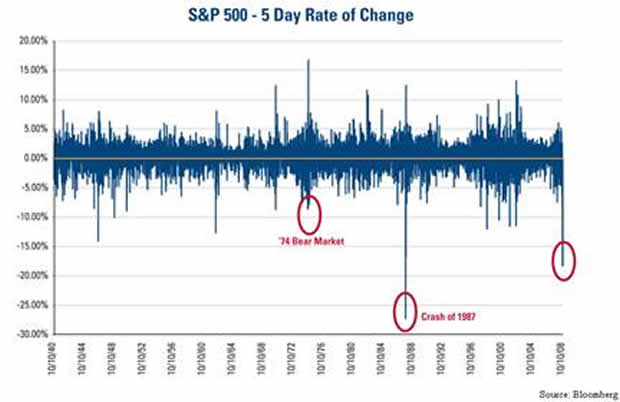
Below is a chart that goes back to 1940, and you can see that what we've recently gone through was the second-worst five-day period of time over the last 68 years. It was essentially a market crash. The only other thing that's really even close was the crash of 1987.
This week you've seen how the markets react after a crash or after a very traumatic period in the market. They go up, they go down, they chop around. They build a base, but it's not a V shaped recovery. These are U shaped recoveries. They take time to develop, and there's going to be a lot of volatility between now and when that next bull market starts.
It would be very unusual to take off from here and just have a V-shaped recovery. The more likely scenario is what we've seen in the past, where you have very sharp rallies accompanied by very sharp falls. We're poised to take advantage of that type of environment.
For the past 52 weeks, the S&P 500 is down more than 40 percent. The only period that was worse was the 1974 bear market, and it was worse by just a percentage point or two.
There is a positive side of all of this sour news – what goes down eventually goes back up. Conditions are ripe for mean reversion, which is a critical element of how we think about markets. We've been in one of the worst markets in the last 70 years over the last year, but the prospects for a rebound going forward, at least based on history, are still pretty strong.
On the chart below I've tried to capture the top of the market back in 2000. To do that, I've used a rolling eight-year rate of change, and you can see that we're experiencing the worst eight years since 1940.
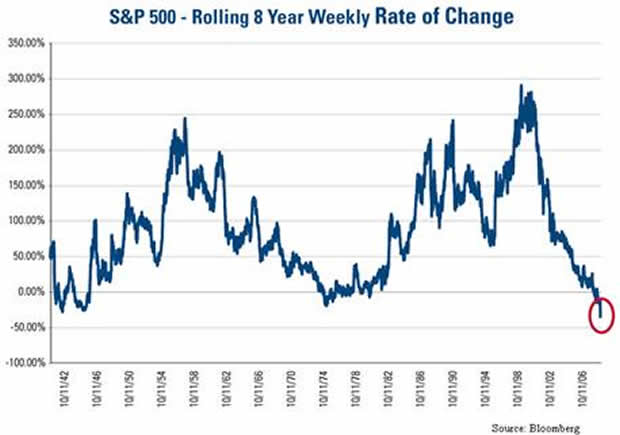
When you look at this historic chart, you can see periods of underperformance and periods of sub-par returns. This was the case in the '40s during World War II, for instance. But then, what happened? Big rallies and big selloffs.
There were strong rallies in the '50s and '60s, and then the market went through a tough period of time in the '70s. After that we had agreat bull market in the 1980s and '90s.
Now, when you look at current markets, you see that this has been a terrible period of time. However, mean reversion tells us that there's a good chance that over the next decade or so, there are going to be returns similar to the 9 percent to 10 percent returns we've averaged since 1929.
As difficult as things are now, we believe this is about as bad as things will get and the outlook going forward is much more positive.
By John Derrick, Director of Research
This commentary is adapted from the U.S. Global Investors webcast “Enduring the Global Financial Crisis,” which aired October 16. A replay of this webcast is available at the U.S. Global Investors website, www.usfunds.com/webcast .
More timely commentary from Frank Holmes is available in his investment blog, “Frank Talk”: www.usfunds.com/franktalk .
Please consider carefully the fund's investment objectives, risks, charges and expenses. For this and other important information, obtain a fund prospectus by visiting www.usfunds.com or by calling 1-800-US-FUNDS (1-800-873-8637). Read it carefully before investing. Distributed by U.S. Global Brokerage, Inc.
All opinions expressed and data provided are subject to change without notice. Some of these opinions may not be appropriate to every investor. Gold funds may be susceptible to adverse economic, political or regulatory developments due to concentrating in a single theme. The price of gold is subject to substantial price fluctuations over short periods of time and may be affected by unpredicted international monetary and political policies. We suggest investing no more than 5% to 10% of your portfolio in gold or gold stocks. The following securities mentioned in the article were held by one or more of U.S. Global Investors family of funds as of 12-31-07 : streetTRACKS Gold Trust.
John Derrick Archive |
© 2005-2022 http://www.MarketOracle.co.uk - The Market Oracle is a FREE Daily Financial Markets Analysis & Forecasting online publication.
Comments
|
Eamon
01 Nov 08, 14:37 |
Keep dreaming...
Keep dreaming, friend. The market, economy, dollar, etc. - indeed, life as we know it - is OVER. |