


The Financial Crisis Next Shoe to Drop
Stock-Markets / Credit Crisis 2008 Nov 01, 2008 - 11:57 AM GMTBy: Marty_Chenard

 To many, things are starting to look rosier. Bank liquidity flows are starting to improve ... not great, but showing some improvement.
At the same time ... Bush knows it hasn't been enough of an improvement, so he warned banks that they better start opening up the lending spigots. Banks are afraid, risk averse, and resisting. Twenty five percent of "excellent credit rating borrowers" are being declined when trying to get a new car loan. Next, I expect that Bush will push the bank Regulatory Agencies to put a lot of pressure on banks to start lending.
In the meantime, the market is now acting like it might want to have an oversold rally. Small investors are embracing the idea, but Institutional Investors have been showing a reluctance.
For months, I have heard financial crisis rhetoric about "when's the next shoe going to drop?". I don't hear that anymore, so maybe investors think the worse is over, and that there are no more shoes to drop. At the same time, many Hedge Funds are in trouble and it is expected that 1,500 to 2,000 may close shop by the end of December.
The overall picture is just not as rosy as some are thinking right now. Improving conditions don't necessarily mean the same thing as "fixed".
Enough rhetoric ... let's move on to today's analysis where we will look at the VIX vs. the S&P 500, and then an alert on an "unexpected shoe that could drop fairly soon".
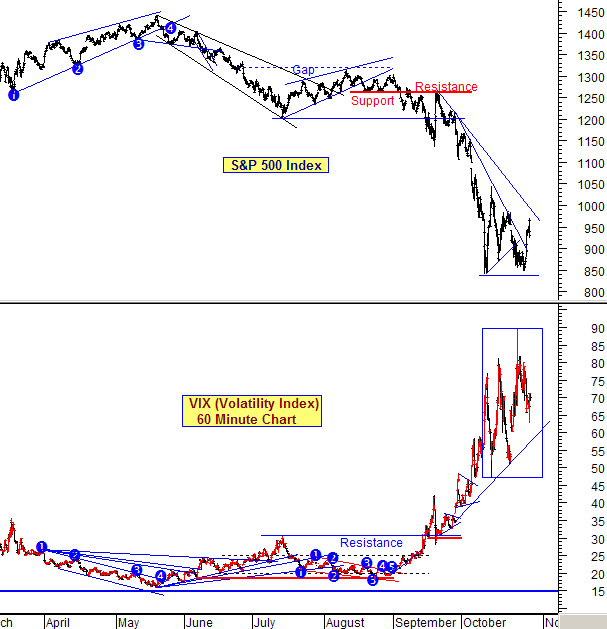
First, let's look at the VIX vs. the S&P 500 chart.
The S&P broke above a resistance level on Tuesday which was a positive ... but it still has the main resistance line of this down move to plow through. So technically, it has not yet broken through the resistance line for the October down move yet.
Now, look at the Volatility. Note the extreme volatility of the VIX in the boxed in area which is reflecting erratic, emotional, and panicking decision making by investors.
Panic levels won't stabilize until the VIX settles down and trends below the support line. Yesterday, the VIX dropped, but remained above the support and it has not negated the up trend yet ... so the VIX remains in a negative condition and is saying that investors are still very worried. The investor "worry trend" will only turn to optimism when the VIX drops below the support line and starts to trend down . See the next chart ...
So ... what is this "unexpected shoe that could drop fairly soon"?
It all has to do with the change in risks that Foreign buyers are perceiving relative to the Treasury auctioning off bonds to keep the government in enough operational cash.
The recent bailouts are both inflationary to the economy, and a reduction in the credit worthiness of U.S. Government's financial instruments. As a result, worldwide buyers of U.S. Treasuries now want higher yields for taking what is now perceived as "higher risks".
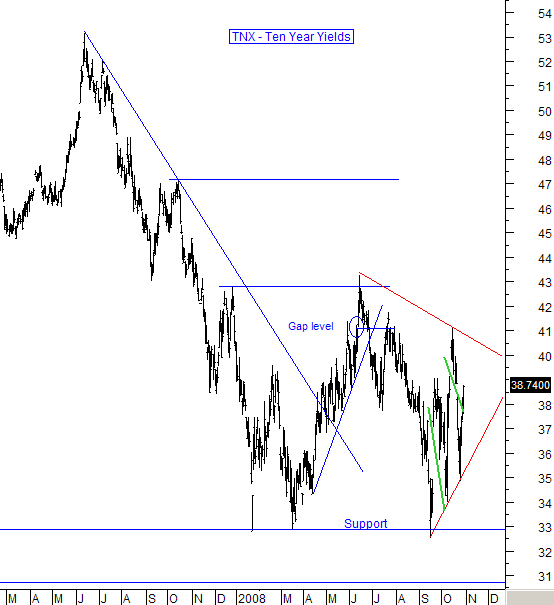
Below is our daily 10 Year Yield chart that we post on our Advanced subscriber site every day .
What does it show?
It shows a 4 month triangular pattern on the yields. It is a rather large pattern where the yields have risen up to the triangle's resistance and pulled back. The 10 year yields have fallen to the triangle's support 3 times and then bounced up.
Somewhere between now and mid-January the latest, the 10 year yields will bust out of this pattern and have a huge move. If it breaks to the downside, it will move well below the horizontal, longer term support and interest rates will drop sharply. (The negative here is that investor perceptions will be that the economy is in worse trouble than they thought.)
However, if the government can't find buyers at their Treasury auctions, then they will have to continue paying higher interest rates ... and the 10 year yields will breakout to the upside. If that happens, we could see the 10 year yields rise to a level of 50 ... yesterday, the 10 year yields were at 38.74.
That would be an increase of 29% ... and that would have a very negative effect on corporate and consumer borrowing. Such high rates would put the economy in a deeper, more prolonged recession. If this happens, then this will turn out to be the next "unexpected shoe to drop".
______________________________________________________________________
*** Feel free to share this page with others by using the "Send this Page to a Friend" link below.
By Marty Chenard
http://www.stocktiming.com/
Please Note: We do not issue Buy or Sell timing recommendations on these Free daily update pages . I hope you understand, that in fairness, our Buy/Sell recommendations and advanced market Models are only available to our paid subscribers on a password required basis. Membership information
Marty Chenard is the Author and Teacher of two Seminar Courses on "Advanced Technical Analysis Investing", Mr. Chenard has been investing for over 30 years. In 2001 when the NASDAQ dropped 24.5%, his personal investment performance for the year was a gain of 57.428%. He is an Advanced Stock Market Technical Analyst that has developed his own proprietary analytical tools. As a result, he was out of the market two weeks before the 1987 Crash in the most recent Bear Market he faxed his Members in March 2000 telling them all to SELL. He is an advanced technical analyst and not an investment advisor, nor a securities broker.
Marty Chenard Archive |
© 2005-2022 http://www.MarketOracle.co.uk - The Market Oracle is a FREE Daily Financial Markets Analysis & Forecasting online publication.