


Is Natural Gas a Complete Failure?
Commodities / Natural Gas Jan 22, 2024 - 01:46 PM GMTBy: Submissions

Thanks to the last week’s declines, natural gas lost 32% and approached the support area. What are the implications?
Major Decline in Natural Gas Prices
Last week, natural gas recorded its biggest decline in months. Could this have been predicted? What technical factors encouraged the bears to attack? What changes did this movement leave behind on the chart? You will find answers to these questions in today's article. Have a nice read!
Let’s start today’s analysis with the quote from the last commentary on natural gas published on Jan. 12:
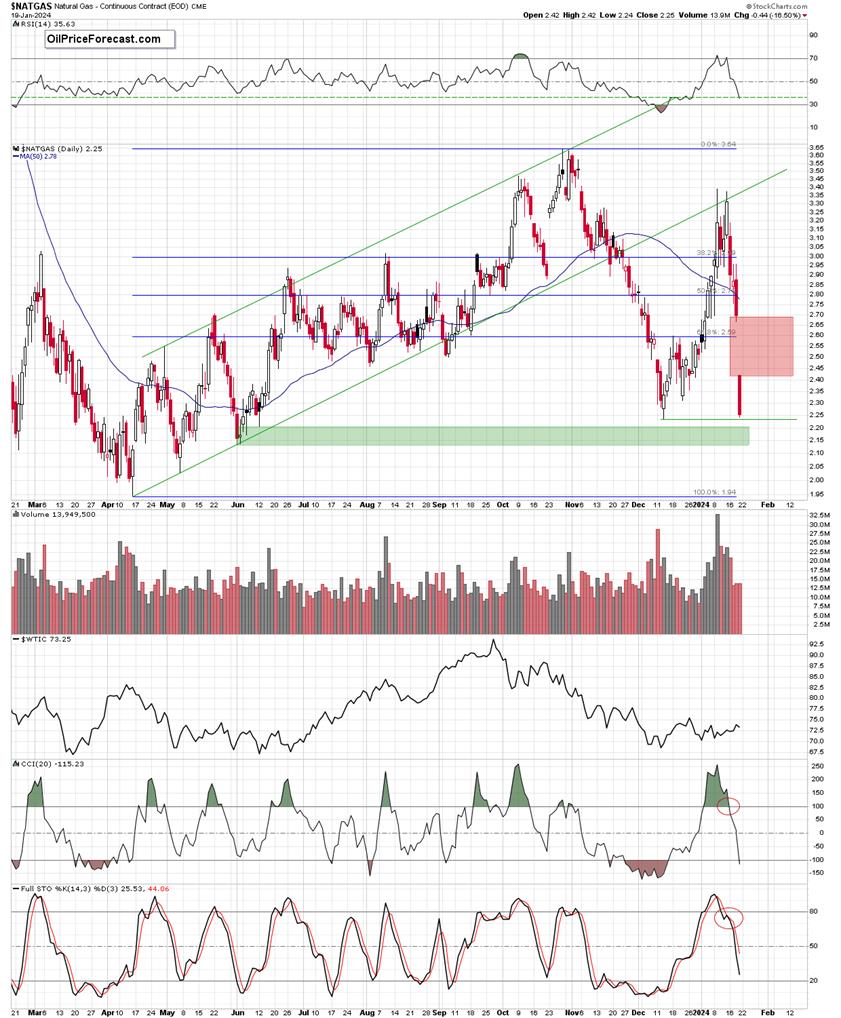
(…) From this perspective, we see that the recent upward move took the price to the previously broken lower border of the green rising trend channel, which looks (at least at the first glance) like a verification of the earlier breakdown.
Although we saw a temporary move above this line, the bulls failed to hold it, which means that the outcome of today’s session may bring a significant breakthrough from a technical point of view.
What do I mean by that?
If the buyers manage to close the week above this key line, the breakdown would be invalidated, which could translate into further improvement. (…)
On the other hand, however, if they fail and natural gas closes the week under this line, the probability of a reversal and lower prices in the coming week will significantly increase. Therefore, keeping an eye on today's behavior of market participants can provide us with important and valuable insights for next week.
On top of that, there were also other technical factors that didn't bode well for bulls and higher prices:
(…) On Jan. 4 and Jan. 8, natural gas opened sessions with another 2 green gaps, which resulted in a move above the 50% Fibonacci retracement based on the entire Oct.-Dec. downward move. On the following day, a huge white candlestick was formed (on the highest volume in weeks), and the bears lost two other allies: the red gap formed on Dec. 27, 2023, and the 61.8% Fibonacci retracement.
(…) this upswing took the price to the biggest red gap created during Oct.-Dec. declines, which translated into a pullback. For the first time in many days, the bulls failed against resistance.
This failure took natural gas below the previously broken 61.8% Fibonacci retracement, invalidating the earlier breakout. Yesterday, there was another unsuccessful attempt to break above it, which doesn’t look encouraging.
Additionally, the RSI generated a sell signal for the first time since mid-October. Back then, such development preceded a deeper correction, which suggests that we could see something similar in the coming days – especially when we factor in the current position of the CCI and the Stochastic Oscillator: the first of them remains in its overbought area, increasing the probability of a sell signal in the very near future, while the latter generated a sell signal, giving the bears green light to attack.
On top of that, the volume, which accompanied yesterday’s upswing was visibly lower than the day earlier (during decline), which raises some concerns about the condition of the bulls.
Confirmation of Bearish Trend
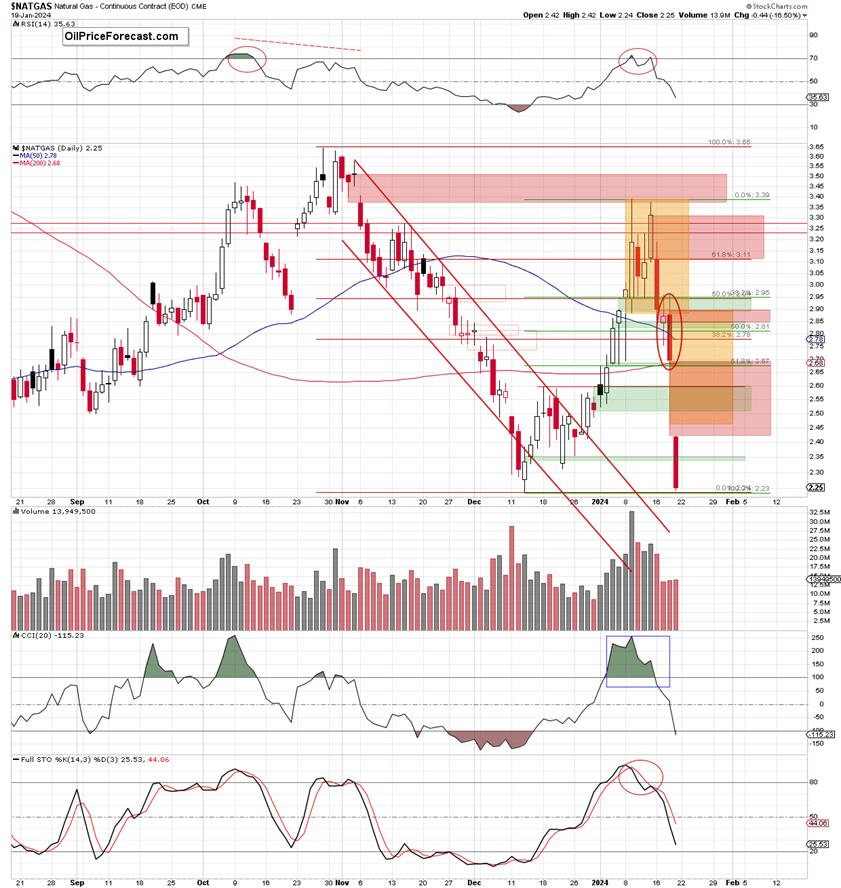
From today’s point of view, we see that although the bulls tried to cross the lower border of the green rising trend channel, this very important resistance line withstood the buying pressure, which, in combination with the above-mentioned big red gap (and other disturbing technical factors) triggered the pro-declining scenario just as expected.
As you can see on the daily chart, this shows the buyers’ weakness resulted in another big red gap at the beginning of the previous week, which resulted in further deterioration that took the price below the 50% Fibonacci retracement (based on the previous upward move).
Although the bulls tried to save themselves, a loss of an ally (supporting green gap created on Jan.8) together with one more red gap (formed on Jan.17) and a breakdown under the lower border of the orange consolidation lured the bears to the trading floor once again.
Thanks to their other attack, the price approached the 61.8% Fibonacci retracement and the 200-day moving average, which could cause further declines. However, the earlier clearly visible bulls’ weakness, in combination with two more red gaps, the breakdown under the lower line of the mentioned consolidation, a breakdown under the 50-day moving average, and sell signals generated by the indicators were still on the bearish side, which did not bode well for stopping the decline – especially when we take into account the size of red candles and the bearish engulfing pattern, which appeared on the chart on Jan. 18 (I marked it with red ellipse).
This cocktail of negative technical factors contributed to another strong decline and a realization of the pro-declining scenario based on the earlier exit from the orange consolidation (as a reminder, according to the rules of technical analysis, a drop below the lower border of the formation triggers a downward move to a level that corresponds to at least the height of consolidation) during the last session of the previous week.
Thanks to this decline the bears took the price to the mid-Dec. lows, but what’s next?
On one hand, this support could trigger a rebound, however, taking into account all the above-mentioned bearish factors, the sell signals generated by the daily indicators, and the fact that natural gas lost 32% in the previous week, it seems more likely that we’ll see further deterioration and a test of the next support area (2.136-2.206) based on June 2023 lows (marked with green on the first chart) in the coming week.
At this point, it is worth noting that if the bulls fail once again, the road to the early-May 2023 or even mid-April 2023 lows could be open.
Nevertheless, please keep in mind that the volume that accompanied recent declines neither grew from session to session nor was huge (or at least large enough to confirm the growing strength of the bears), which raises the first doubts as to whether the southward movement will continue as strongly as last week.
Therefore, in my opinion, careful observation of the behavior of market participants seems to be the best idea at the moment.
Summing up, the clearly visible weakness of the bulls in the middle of the month turned out to be downright tragic for them last week. The bear attack led to the strongest decline in many months and erased all the previous upward movement that we could observe from mid-December to mid-January. The volume accompanying this downward move raises some concerns about the strength of further declines, but a multitude of bearish technical factors suggest that we’ll likely see a test of the next support(s) in the coming week(s).
If you’d like to know what the current technical picture of crude oil is or to find out what arguments the bulls have or what allies do the bears have, I encourage you to subscribe to Oil Trading Alerts, where you’ll find the answers to these (and many other) questions.
See you tomorrow.
Thank you.
Anna Radomski
Founder, Editor-in-chief
Tools for Effective Gold & Silver Investments - SunshineProfits.com
Tools für Effektives Gold- und Silber-Investment - SunshineProfits.DE
* * * * *
About Sunshine Profits
Sunshine Profits enables anyone to forecast market changes with a level of accuracy that was once only available to closed-door institutions. It provides free trial access to its best investment tools (including lists of best gold stocks and best silver stocks), proprietary gold & silver indicators, buy & sell signals, weekly newsletter, and more. Seeing is believing.
Disclaimer
All essays, research and information found above represent analyses and opinions of Przemyslaw Radomski, CFA and Sunshine Profits' associates only. As such, it may prove wrong and be a subject to change without notice. Opinions and analyses were based on data available to authors of respective essays at the time of writing. Although the information provided above is based on careful research and sources that are believed to be accurate, Przemyslaw Radomski, CFA and his associates do not guarantee the accuracy or thoroughness of the data or information reported. The opinions published above are neither an offer nor a recommendation to purchase or sell any securities. Mr. Radomski is not a Registered Securities Advisor. By reading Przemyslaw Radomski's, CFA reports you fully agree that he will not be held responsible or liable for any decisions you make regarding any information provided in these reports. Investing, trading and speculation in any financial markets may involve high risk of loss. Przemyslaw Radomski, CFA, Sunshine Profits' employees and affiliates as well as members of their families may have a short or long position in any securities, including those mentioned in any of the reports or essays, and may make additional purchases and/or sales of those securities without notice.
© 2005-2022 http://www.MarketOracle.co.uk - The Market Oracle is a FREE Daily Financial Markets Analysis & Forecasting online publication.