


Gold Price To Re-Test $2,700
Commodities / Gold & Silver Stocks 2024 Nov 21, 2024 - 04:04 AM GMTBy: P_Radomski_CFA
 That’s an interesting situation that we have today. Gold us up, but silver and miners are down. What gives?
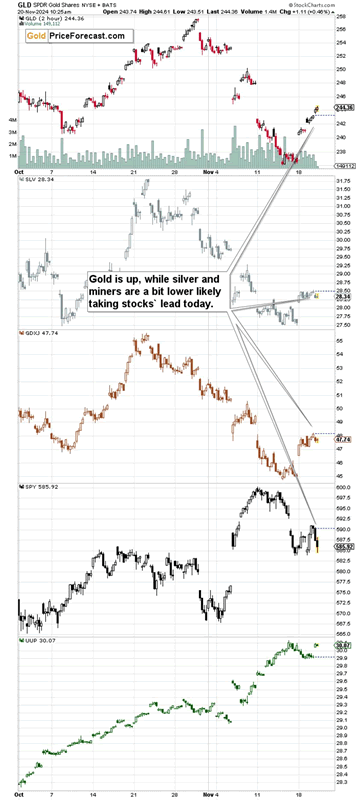
In short, it’s almost certainly all about the temporary impact from the stock market. The S&P 500 Index is down today. Not significantly, but enough to make the parts of the precious metals market more linked to it underperform.
Mining Stocks: Strength in the Current Setup
GDXJ is down by 0.95% so far today while the GDX is only down by 0.65% - and that’s perfectly normal given stocks’ move lower. After all, junior miners are more linked to stocks than senior miners are. This is also the reason as to why I’m currently writing about being long GDX and not GDXJ, while it will be GDXJ that I will focus on shorting soon.
On a side note, the GDX is up by 6.08% so far this week while the GDXJ is up by 5.81% - it seems that my selection of the proxy for going long was correct.
Are stocks done rallying here? This might be the case, but I get the feeling that we’ll see another quick move up soon and that we’re going to see the opposite in the USD Index. The latter is the reason for both. After all, cheaper dollar means more competitive exports for the U.S. economy.
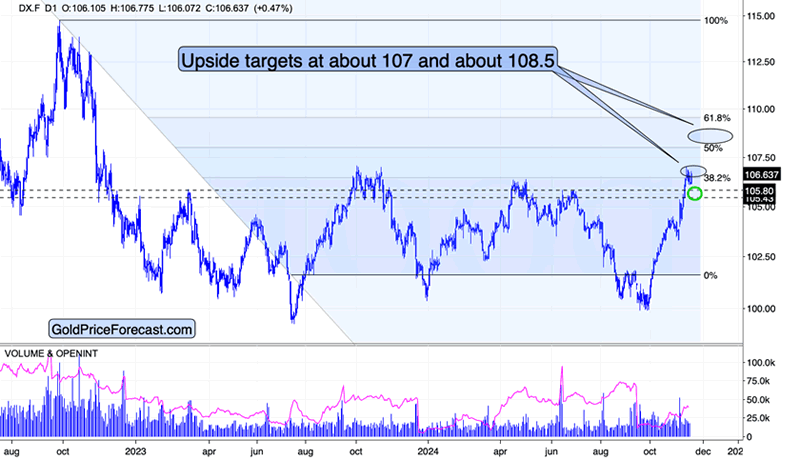
The USDX is after reaching my first upside target, but it didn’t correct to the green buy area yet.
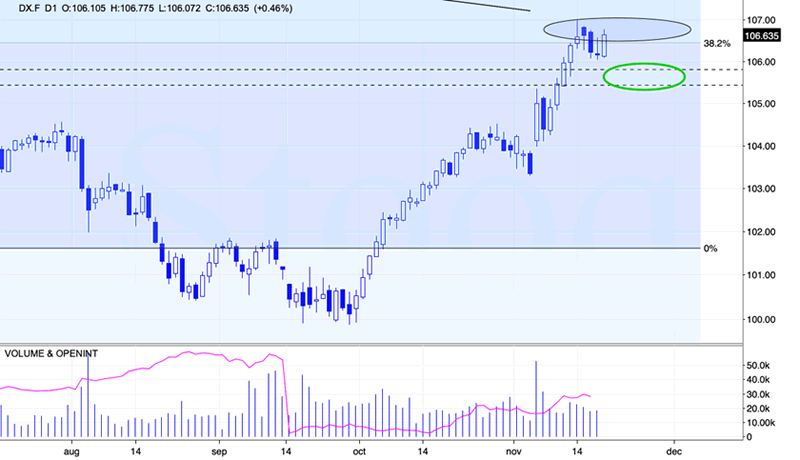
Today’s rally might be the B part of the ABC (zigzag) decline. Please note that we saw the same thing at the beginning of this month. The USDX rallied visibly for one day and then it continued to move lower with the bottom forming two trading days after the daily rally.
The history rhymes, so we could see something like that in the following days as well.
Also, today’s gold-USD reaction (gold is up despite a move higher in the USD) makes me think that the rally in the former is not over yet even though it is already within my previous target area.
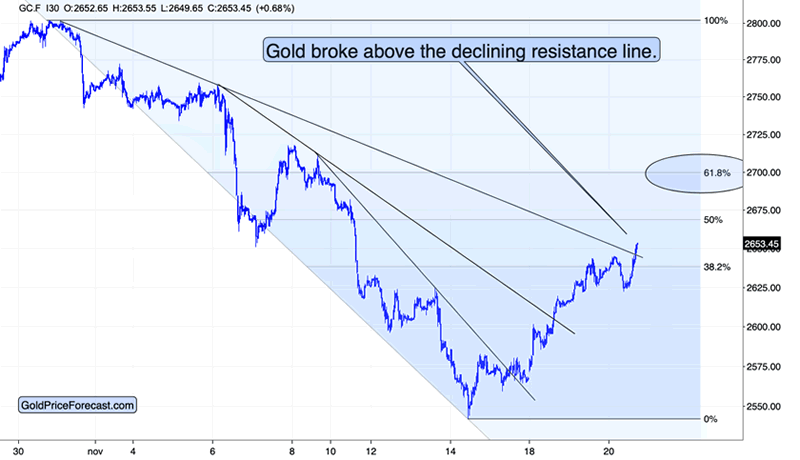
Based on today’s breakout above the declining, short-term resistance line and the above-mentioned gold-USD link, it seems that gold can really move all the way up to $2,700 (which is also its 61.8% Fibonacci retracement for this correction) before the top is in.
The near-term outlook is bullish and now it’s clear that the bottom indeed formed when I wrote about it on Thursday. Of course, the focus is on the “near term” here, and the below chart featuring world stocks shows why this should be the case.
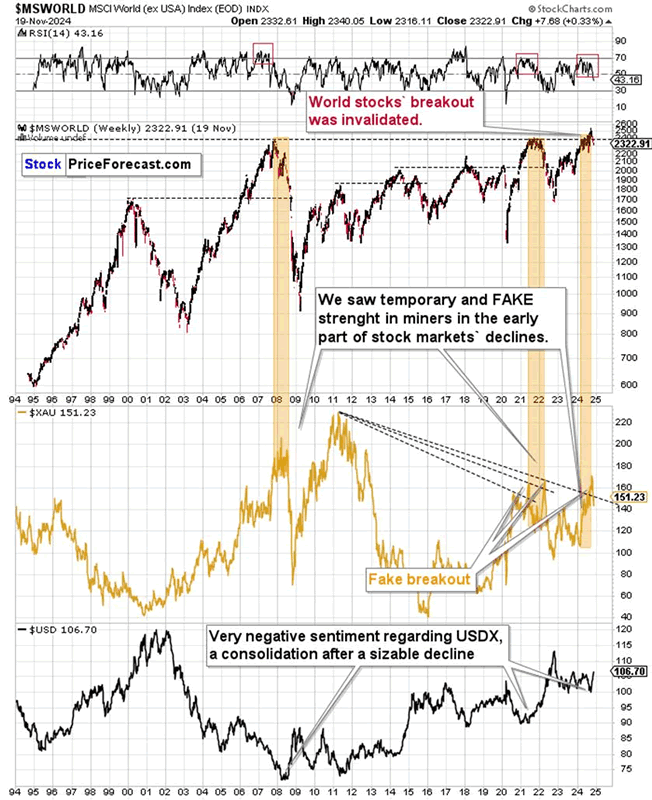
First of all, we saw an invalidation of the move above the previous highs in world stocks.
Second, we saw that when the USD Index started to rally after being severely beaten up and when the sentiment for it was very bad (and everyone and their brother kept repeating various reasons for “de-dollarization”).
The latter is important because it shows that it’s not “just a decline from the same price levels” that makes the current situation like the 2007/2008 and 2022 tops.
It could be the case that tariffs that Donald Trump is proposing are being discounted in the price and world stocks fall in result. After all, despite political reasons for them, this is something that is likely to be bad for the international trade, and thus many of the world economies could be affected.
And what happened in both above-mentioned cases when world stocks fell? The mining stocks truly plunged. And this, my friends, is the likely outlook for the following months, despite the current corrective upswing.
Still, for now, it seems that the profits from our long positions will increase some more before we close them.
Corrections like the current are useful not just because they can be profitable, but because they can tell you which parts of a given market or sector are likely to fall when the next move lower takes place.
Copper and Broader Commodities
As you know, I’ve been commenting on the bearish potential of FCX, and given the size of its upswing right now, all those bearish points remain up-to-date.
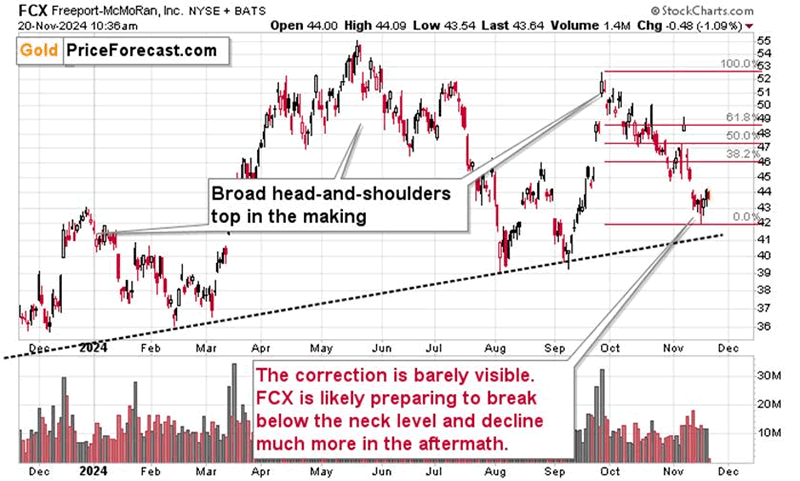
Please note how weak the current move up is. It’s not even halfway to the first of the classic Fibonacci retracement levels – the 38.2% one.
Once we see another move lower in copper (and we’re likely to see it), FCX is likely to break below the neck level of the head and shoulders top pattern and then decline in a truly profound manner.
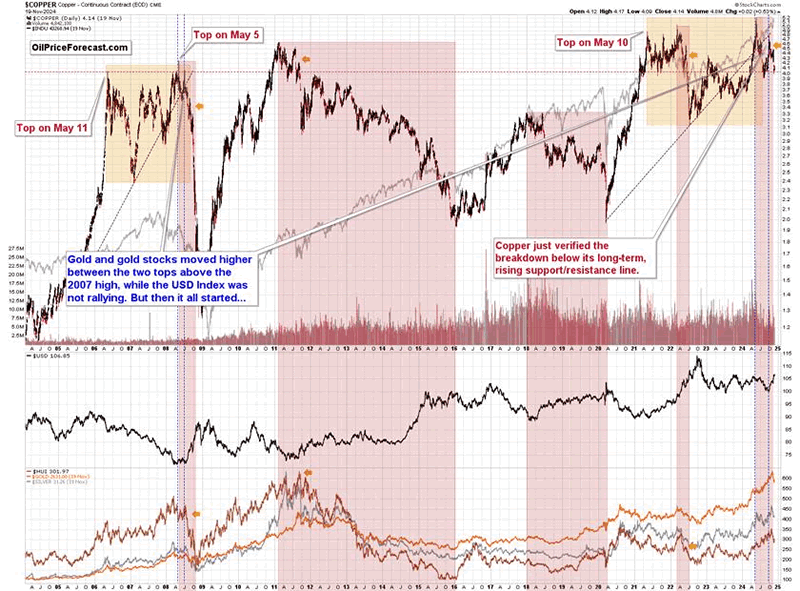
Why am I writing about copper here? One is because FCX and copper itself offer great shorting opportunities in my view, but the other is that copper and precious metals tend to be aligned during the really big moves and given that copper is on the verge of invalidating the move above its 2006 high, it seems that the decline that is going to follow will not be minor.
In the near term both: copper and FCX could move higher, though. The same is the case with crude oil which might form the inverse head-and-shoulders pattern here (as Anna discussed in today’s Oil Trading Alert, which we’re making free for you as a courtesy).
Naturally, the above is up-to-date at the moment when it was written. When the outlook changes, I’ll provide an update. If you’d like to read it as well as other exclusive gold and silver price analyses, I encourage you to sign up for our free gold newsletter.
Przemyslaw Radomski, CFA
Founder, Editor-in-chief
Tools for Effective Gold & Silver Investments - SunshineProfits.com
Tools für Effektives Gold- und Silber-Investment - SunshineProfits.DE
* * * * *
About Sunshine Profits
Sunshine Profits enables anyone to forecast market changes with a level of accuracy that was once only available to closed-door institutions. It provides free trial access to its best investment tools (including lists of best gold stocks and best silver stocks), proprietary gold & silver indicators, buy & sell signals, weekly newsletter, and more. Seeing is believing.
Disclaimer
All essays, research and information found above represent analyses and opinions of Przemyslaw Radomski, CFA and Sunshine Profits' associates only. As such, it may prove wrong and be a subject to change without notice. Opinions and analyses were based on data available to authors of respective essays at the time of writing. Although the information provided above is based on careful research and sources that are believed to be accurate, Przemyslaw Radomski, CFA and his associates do not guarantee the accuracy or thoroughness of the data or information reported. The opinions published above are neither an offer nor a recommendation to purchase or sell any securities. Mr. Radomski is not a Registered Securities Advisor. By reading Przemyslaw Radomski's, CFA reports you fully agree that he will not be held responsible or liable for any decisions you make regarding any information provided in these reports. Investing, trading and speculation in any financial markets may involve high risk of loss. Przemyslaw Radomski, CFA, Sunshine Profits' employees and affiliates as well as members of their families may have a short or long position in any securities, including those mentioned in any of the reports or essays, and may make additional purchases and/or sales of those securities without notice.
Przemyslaw Radomski Archive |
© 2005-2022 http://www.MarketOracle.co.uk - The Market Oracle is a FREE Daily Financial Markets Analysis & Forecasting online publication.