


The Important Connection Between Stock Market New Lows and Relative Strength
Stock-Markets / US Stock Markets Dec 03, 2008 - 02:40 PM GMTBy: Marty_Chenard

 What can the NYA New Lows vs. the S&P's Relative Strength tell you about the market?
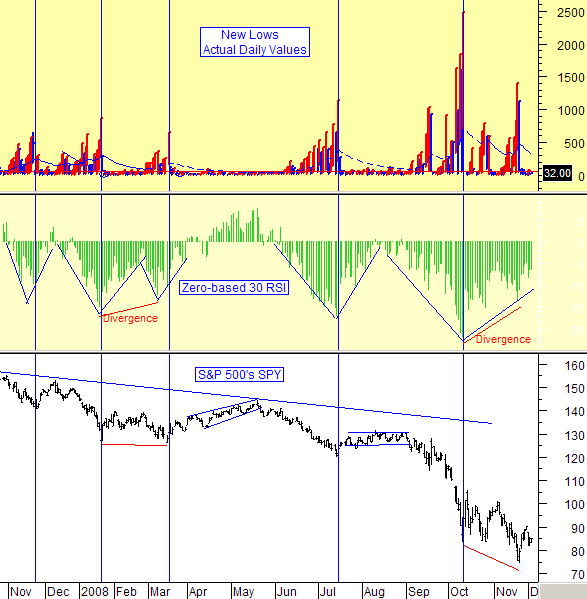
We have discussed the NYA "New Daily Lows" vs. the market many times before. Basically, when New Lows fall to below 50 to 28 per day, the market faces a condition where investors have pretty much stopped the big selling and have decided to hold on to the stocks they are still in.
In the top graph of the chart below, I drew a horizontal red line at a level of 50 or below on the NYA New Daily Lows. By observing the times the New Lows were below this line, and looking at the SPY's price chart, you can see that the market stops going down at these levels.
But sometimes, at 50 or below on New Lows, the market goes sideways and other times it goes up .
Why is that, and what determines which will happen?
The answer to the question resides in what is going on with the 30 RSI on the SPY or S&P 500.
The relationship is pretty straight forward ...
1. If the NYA New Lows are below 50 and the zero-based RSI is Negative , then the S&P moves in a sideways trading range.
2. If the NYA New Lows are below 50 and the zero-based RSI is Positive , then the S&P moves up in a rally like we saw in March to May of this year.
I know you are wondering ... what is a Zero-based (RSI) Relative Strength Index?
The answer: A normal RSI range is from 0 to 100. A level of 50 is neutral with 55+ having a decided advantage, and a level of 45- has a decided disadvantage. In the charts that we show on our paid subscriber site, we Zero-base the RSI. What that means is, that I have written a short program that takes the current value and subtracts 50. Therefore a traditional RSI of 50 becomes Zero or neutral on our RSI indicator. If our RSI moves to 55, you can clearly see it is positive. Why to we do this? Because it needs no interpretation and requires no double checking of what the RSI number is at any point in time ... in other words, it is investor friendly.
*** Feel free to share this page with others by using the "Send this Page to a Friend" link below.
Can we help each other? Actually, yes. Our mission is to help you each day ... so you can know what is going on in the market, and to teach you new things like today's update. How could you help us? We depend on "word of mouth" activity by visitors like yourself ... by telling others about our free , StockTiming.com daily stock market updates. If you enjoy your daily updates and have found them beneficial, then please think about returning the favor and telling others about StockTiming.com. We do no paid advertising , so we count on each of you to help spread the word.
Many Thanks,
Marty Chenard
____________________________________________________________________
*** Feel free to share this page with others by using the "Send this Page to a Friend" link below.
By Marty Chenard
http://www.stocktiming.com/
Please Note: We do not issue Buy or Sell timing recommendations on these Free daily update pages . I hope you understand, that in fairness, our Buy/Sell recommendations and advanced market Models are only available to our paid subscribers on a password required basis. Membership information
Marty Chenard is the Author and Teacher of two Seminar Courses on "Advanced Technical Analysis Investing", Mr. Chenard has been investing for over 30 years. In 2001 when the NASDAQ dropped 24.5%, his personal investment performance for the year was a gain of 57.428%. He is an Advanced Stock Market Technical Analyst that has developed his own proprietary analytical tools. As a result, he was out of the market two weeks before the 1987 Crash in the most recent Bear Market he faxed his Members in March 2000 telling them all to SELL. He is an advanced technical analyst and not an investment advisor, nor a securities broker.
Marty Chenard Archive |
© 2005-2022 http://www.MarketOracle.co.uk - The Market Oracle is a FREE Daily Financial Markets Analysis & Forecasting online publication.