


Martin Armstrong and the Stocks Bear Market
Stock-Markets / Stocks Bear Market Dec 29, 2008 - 02:24 AM GMTBy: Brian_Bloom

 Armstrong's “It's just time” - A friend was kind enough to send me the following link to an article dated October 10 th 2008, written by Martin Armstrong. http://www.scribd.com/.. For those who have never heard of him, Armstrong is possibly the most knowledgeable man on the planet regarding the subject of cycles as they apply to social behaviour. He developed a complex forecasting model – based on fractal natural cycles (cycles within cycles within cycles) – which was so accurate according to Armstrong that it came to the attention of the CIA who sought to acquire ownership of and control over it. As Armstrong tells it, when he turned the CIA down they contrived to ensure that he was sidelined and they took his computer anyway, which led to his source code self-destructing when it was tampered with.
The article was written whilst Armstrong was in jail. In it, he claims that he was incarcerated without due process of the law for a period of 7 years – at the whim of the presiding judge – pursuant to an alleged crime of market manipulation (conspiracy to commit fraud) which, if he had been tried and found guilty would have carried a maximum 5 year sentence. Effectively, in his words, he is “serving a 12 year sentence for a pretended offense that by law cannot justify more than five years when guilty” (At page 64)
Here is a quote from a New York Times article published on April 28 th , 2007 (source: http://www.nytimes.com/..):
“Jailed 7 Years for Contempt, Adviser Is Headed for Prison
By MICHAEL J. de la MERCED
Published: April 28, 2007
A federal judge lifted a seven-year-old civil contempt sanction on the financial adviser Martin A. Armstrong yesterday, allowing him to begin serving a five-year sentence for conspiracy to commit fraud.
The decision by Judge P. Kevin Castel of Federal District Court in Manhattan ends one of the longest-running cases of civil contempt in American legal history. It will finally pry Mr. Armstrong, 57, from the Metropolitan Correctional Center in Lower Manhattan , where he has been held since January 2000.”
Readers will note that the above makes no reference to Armstrong having been tried for anything at all under due process of the law. It talks about a five year “sentence”. If there was a sentence then why was it necessary to jail him for 7 years for contempt before he was even allowed to “begin serving a five-year sentence for conspiracy to commit fraud” ?
One of the most important arguments in Armstrong's article is that the Rule of Law in the USA is dead and that without a Rule of Law foreign investment in the country (on which it is life-or-death dependent) will inevitably dry up. He correctly observes that the most advanced countries in the world are those wherein the Rule of Law is sacrosanct; and those countries which are pariahs within the community of nations are countries where the Rule of Law does not exist. The reader just has to think of Zimbabwe to validate this concept.
Amongst other things, Armstrong is also anticipating a further down leg in the US equity markets which his model forecasts will commence on March 19 th 2009 and will culminate on June 13 th 2011.
For what it's worth the dates gel very roughly with my own relatively amateurish technical analysis and no-one in his right mind would even think of accusing me of trying to manipulate world markets. Self evidently, anyone accusing me of “conspiring to commit fraud” would have to prove two things:
- Opportunity : - Which it could be argued I have via the medium of my articles which are read by a proportion of the over one million visitors a month, world-wide, to various web sites on which my editorial comments are published
- Motive: - That there was evidence of fraudulently contrived benefit on my part; or potential fraudulently contrived benefit.
In my case, such an accusation would be laughable. There is absolutely no such evidence. In Armstrong's case there is reasonable doubt that any such evidence existed and, in his case, it wasn't funny.
Presumably Armstrong's accusers could prove 1 above, but 2 above would have been far more onerous. There would have to have been some historical linkages demonstrated between his market calls and movements on his bank account – from sources other than transparently contracted, fee paying clients. In the USA , as in the UK and Australia , an accused is presumed innocent until proven guilty. Apparently, in Armstrong's case, that did not happen. Furthermore, one must also ask why his case – in which he was being accused of activities allegedly prejudicial to the public interest – was heard in camera; as was apparently the situation with Armstrong?
At face value, this set of circumstances has the smell of corruption in high places in the USA and raises serious questions about the integrity of the Rule of Law in that country. All that we know for sure is that Armstrong's model was making some remarkably accurate predictions. But why does it follow that, therefore, there was something crooked going on? Maybe, if it walks like a duck, and it looks like a duck and it quacks like a duck, then it is a duck. Maybe he had indeed cracked some Universal code relating to repetitive cycles and his model was just an extraordinarily accurate forecasting tool. In any country whose laws are based on British law, the onus would have been on the prosecution to prove that his model couldn't do what he claimed of it. The dismissive wave of a hand and/or a supercilious cluck of the tongue are not appropriate responses when a man is facing the deprivation of his freedom.
Let's take a closer look at some of the evidence:
Of particular interest to me was that a significant proportion of Armstrong's latest article independently validated some of the research which underpinned my novel, Beyond Neanderthal. (The novel can be purchased at www.beyondneanderthal.com ). References by Armstrong to Gematria (the ancient Kabalistic study of numbers that have been codified in letters and words – see http://en.wikipedia.org/wiki/Gematria ) are in complete resonance with one of Beyond Neanderthal's themes – which is that the Ancients knew a lot more than we give them credit for – in particular about the structure of our Universe. And it is for this latter reason that I am taking very seriously the epoch cycle end date of December 21 st 2012 – as forecast by both the Mayan Calendar and the I-Ching.
In an earlier article entitled “November 19 th , 2007” ( http://www.gold-eagle.com/.. ) I quoted author Carl Johan Calleman as forecasting the epoch end date as October 28th 2011. Calleman's and Armstrong's culmination forecasts are roughly 20 weeks apart.
Also of particular relevance to this analyst's thought processes was that Armstrong talks about a “Phase Transition” in respect of physical systems – including economic systems. Here is what he says (at page 14): “ A pot of water[that is being heated] progresses in temperature, but toward the end, it jumps into a chaotic state that erupts at the boiling point creating a Phase Transition as water converts to steam…. The process does not follow the Bell Curve but becomes an exponential move at the end, which we call the Phase Transition. … Some have referred to this as the science of ‘chaos' yet it is far from ‘chaos' in that it is a natural and required function within nature.” This view of Armstrong's is in accord with my own oft-stated view that the world economy is heading for the culmination of an era which was characterized by a preoccupation with materialism.
There has recently been much debate amongst commentators regarding whether the equity markets may have bottomed at the current level and whether we may be heading for a strong secondary bounce. If we are then, according to Armstrong, that bounce will peak out on March 19 th 2009.
Although I am in fundamental agreement with Armstrong and I defer to his far superior understanding of the cyclical forces at work, I am incapable of sublimating my own inclinations to the conclusions of a computer model. My own view is that I see no practical purpose in trying to pinpoint an exact date so far in advance. I would rather let the market itself reveal its secrets when it is ready.
So what is the market saying at present?
In an article posted last week, entitled “Dangerous Developments” ( http://www.gold-eagle.com/.. ) I outlined the logic which underpinned the argument that the $SPX might fall by 33% from current levels based on a realignment of Price:Earnings ratios from an overall rough15X to an overall 10X or less. Of course, this alignment of P/Es might occur slowly and share prices might trend sideways for many years as earnings grow to support current prices. Alternatively, it might happen quickly – which will be more likely – if/when a mood of depression envelops the investment world.
I also made reference to a possible break down last week from a rising wedge formation on the $SPX chart and a simultaneous breakdown from a “diamond” reversal formation which, on rare occasions, turns out to be a continuation formation.
Because of the end-of-year holidays, volume has been extraordinarily low and so the apparent breakdown on the daily chart may be false. For that reason I decided to look at some of the more esoteric technical indicators for clues – and here is what I found. (Note: All charts below are courtesy of Decisionpoint.com)
Chart 1: Percentage of NYSE Stocks above 200 day MA
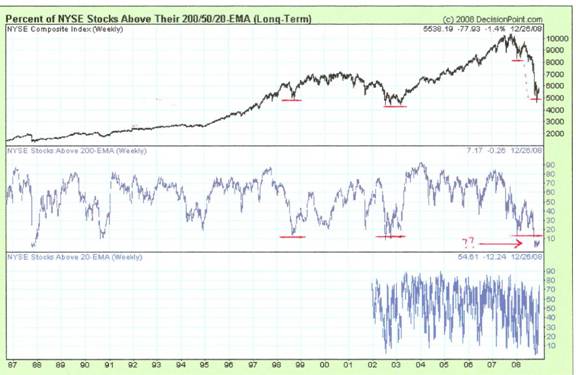
The chart above shows the percentage of NYSE stocks above their 200 day MA. The reader's attention is drawn to the red horizontal bars highlighted. Historically, when the percentage falls to around 10%, the market has bottomed out – except for the last two times. The penultimate time (late 2007) the NYSE composite fell from around 8000 to 5000 after the 10% level was reached on the oscillator, and the last time (late 2008) the percentage fell below 10%. Clearly, something has changed. Yes, the market may bounce up from here, but ceteris is no longer paribus. Everything else is no longer equal.
What has changed may be evidenced by the dollar weighted volume chart in the lower section of the chart below.
Chart 2: SPX Dollar Weighted Volume
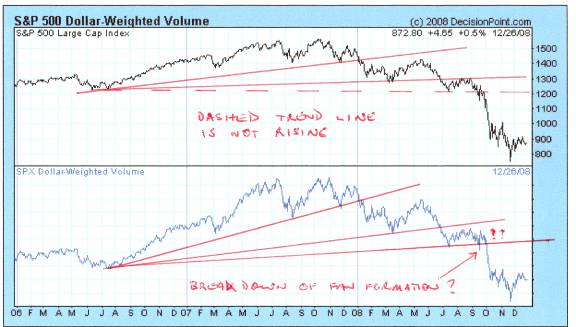
Similar to an On-Balance-Volume chart, this chart goes beyond just volume of shares that have changed hands and it plots a multiple of volume by price to show movements in dollar weighted volume. (See lower section)
This particular chart shows a breakdown from a rising three line fan formation which formation might have been missed if analysis had been confined to the top chart only. The breakdown on the lower chart, which occurred in October, has already shown a bounce upwards back towards the lower trend line. Yes, this is in accordance with text book theory. Yes, it could bounce higher. But this breakdown should be taken very seriously. Whichever way you look at it, it is a bearish formation. This is not a time for investors to get back into the market.
The lower third segment of the chart below reflects the percentage of Point and Figure Charts of NYSE stocks which are manifesting buy signals
Chart 3: NYSE Bullish Percentage Index
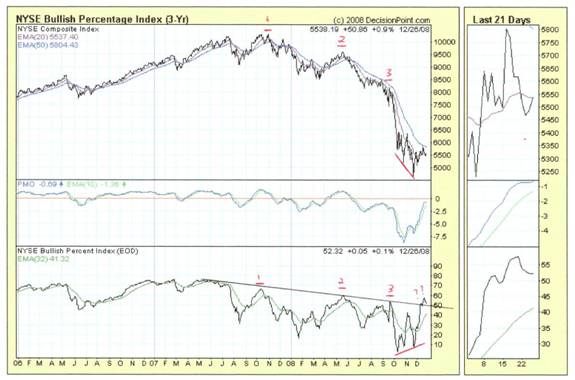
The readers attention is drawn to the fact that whilst the relatively tame “bounce” in share prices (which was a more enthusiastic bounce when shown in dollar weighted volume terms) the bounce in Bullish Percentage chart broke above a declining trend line. Given the non-confirmation shown by the red trend lines, does this mean that market still has some upside before it peaks out?
Perhaps, but note that the PMO oscillator is still below the zero level, and there are still two other clues to be presented.
The first is the Put/Call ratio chart below
Chart 4: 10 Day Moving Average of Put/Call Ratios
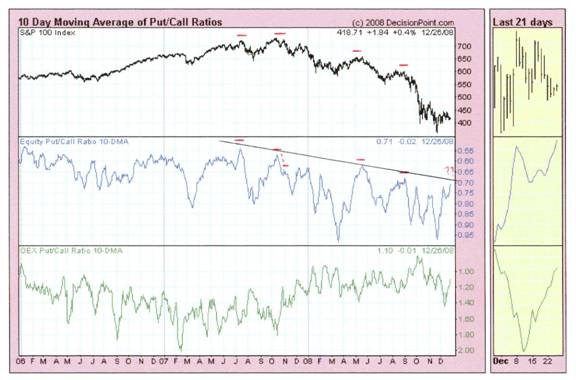
Note from the red horizontal bars how the Put/Call ratio has “peaked” at almost identical points of the market having peaked going back to August last year. (The ratio historically oscillated between 0.95 (roughly equal puts to calls) to 0.55 (roughly double calls to puts). By contrary (perverse) argument, the higher the number of calls and the lower the put/call ratio, the more risk there is that the market is close to a top.
Arguably, the ratio could rise (fall) from its current 0.7 to 0.55 and, therefore there is still some upside to the market. However, note also that the Put/Call ratio has been experiencing a series of falling tops as investors have become less and less optimistic over time. Will the ratio break up through the falling trend line and allow one last surge in share prices?
Not according to the chart below of % PMO Cross-over buy signals of the $SPX , which seems to be rolling over from its high of 90% just as the percentage PMO Above Zero is reaching 50%.
Chart 5: SPX Price Momentum Oscillator Analysis
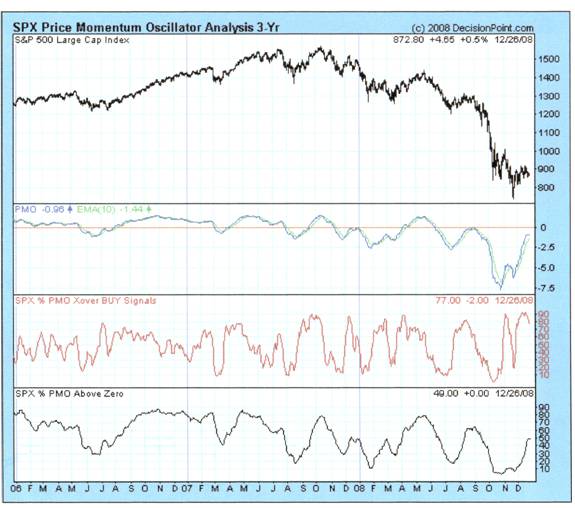
What this latter chart is telling us is that, very likely:
- The breakup on the Bullish Percentage chart #3 may be “false”
- The equity put/call ratio in chart #4 may bounce down when it encounters the resistance of its falling trend line
- The PMO of the SPX seems likely to turn down from the zero level
- The number of Xover Buy signals will very likely contract from the 80% level – given that it had already peaked at the 90% level.
Conclusion
In context of:
- A likely downward adjustment in Price:Earnings ratios as foreshadowed in my previous article, and
- Martin Armstrong's call that the next down leg will likely commence on March 19 th 2009 and continue until June 11 th 2011, and
- 2-4 above showing deteriorating sentiment already creeping in even as the market bounced up from its lows
… it seems foolhardy for investors to re-enter the market at this time (assuming you sold out in February 2008) and it seems opportune for investors still invested to liquidate their equity investments.
Author's Note:
Does the above constitute this analyst calling the market as he sees it, or does it constitute his attempting to manipulate the market?
In my view we have a shrinking window of opportunity to ensure that the Rule of Law is firmly re-established in the USA . The idea of incarceration without trial in the name of Homeland Defense (or any other spurious reason), and the idea that the Secretary of the Treasury can seek to withhold information from the general public about the application of their money, and the idea that billions of dollars of “bailout” money can be handed to investment banks even as billions of dollars of bonuses are paid to senior executives of those same banks – these are despicable affronts to the senses of decency and fair play of the average person in the street.
If his claims are true, it is nothing short of sickening that Martin Armstrong should have been treated in the manner he described in his article. The time has come for a shift in social attitudes towards humaneness and decency and the time has come to unceremoniously boot out from elected office the pork barreling and favor trading politicians and also their nominated cronies in positions of power. It's just time. Elected officials are supposed to protect your and my interests – not their own.
By Brian Bloom
Beyond Neanderthal is a novel with a light hearted and entertaining fictional storyline; and with carefully researched, fact based themes. In Chapter 1 (written over a year ago) the current financial turmoil is anticipated. The rest of the 430 page novel focuses on the probable causes of this turmoil and what we might do to dig ourselves out of the quagmire we now find ourselves in. The core issue is “energy”, and the story leads the reader step-by-step on one possible path which might point a way forward. Gold plays a pivotal role in our future – not as a currency, but as a commodity with unique physical characteristics that can be harnessed to humanity's benefit. Until the current market collapse, there would have been many who questioned the validity of the arguments in Beyond Neanderthal. Now the evidence is too stark to ignore. This is a book that needs to be read by large numbers of people to make a difference. It can be ordered over the internet via www.beyondneanderthal.com
Copyright © 2008 Brian Bloom - All Rights Reserved
Disclaimer: The above is a matter of opinion provided for general information purposes only and is not intended as investment advice. Information and analysis above are derived from sources and utilising methods believed to be reliable, but we cannot accept responsibility for any losses you may incur as a result of this analysis. Individuals should consult with their personal financial advisors.
Brian Bloom Archive |
© 2005-2022 http://www.MarketOracle.co.uk - The Market Oracle is a FREE Daily Financial Markets Analysis & Forecasting online publication.