FTSE 100 Index Stock Market Forecast 2009
Stock-Markets / UK Stock Market Jan 20, 2009 - 07:21 PM GMTBy: Nadeem_Walayat

 I am expecting the FTSE stock market index to follow a similar trend to the Dow Jones, however the ongoing currency crash means that the FTSE 'should' perform relatively more strongly than the Dow as a consequence of the exchange rate movement. The in-depth analysis of October 2008 - Stocks Bear Market Long-term Investing Strategy that accurately forecast the 20% corrective rally (that appears to have terminated) to be followed by a subsequent stocks bear market low in Mid 2009, included was the strategy of scaling into the market at the rate of 10% of funds allocated to stock market investing per each month that the stock market was within 10% of its lows. The bear market rally following the October low has been very weak, which suggests much lower trading than the October low.
On balance the October analysis still stands and has been reinforced by subsequent events that point towards a break of the October low of 3665, how low will stocks go? A break of 3665 would trigger a trend towards the previous 2000-2003 bear market low of 3277, with strong support at 3,000. However that would be a worse case scenario.
The current technical picture is that of a weak market, the rally could resume but it is too weak to imply that any significant trend reversal is taking place hence the 3665 low is very likely to be breached. However I do still expect the 2009 low to mark a significant low from which there will be an initial strong bounce into 2010 . Now the question is on where will the stock indices close by year end ? Well that will depend on where the low is !, as I expect at least a 35% bounce from the lows to year end ,therefore if stocks put in a double bottom at say 3,700 that would suggest an year end FTSE of 5,000. On the other hand if the market crashes through the October lows amidst another panic towards 3,400 (appears probable) then the minimum 35% rally to year end would take the market to 4,600 during December 2009. Which means that forecast for the FTSE into December 2009 will be much clearer by mid 2009, as the below graph illustrates with the most probable trend as follows:
FTSE 100 Index Mid 2009 Low 3400 - 70% Confidence; End 2009 at 4,600 (During December 2009) - 70% Confidence
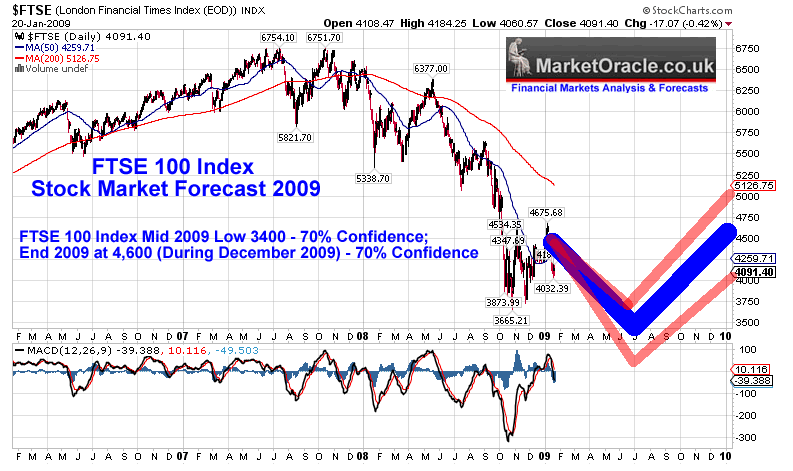
In Summary- The FTSE looks set to break below the previous low, however I expect the FTSE to outperform other indices with a minimum 35% move from the years low and finish Up on the year, my best estimate at this time is for the FTSE to trade at 4,600 or higher during December 2009. Also I am expecting that 2009 will mark the start of a multi-year bull market that will eventually make 2008-2009's price action appear as a mere minor blip, much as the 1987 crash appears on today's price charts.
Two Point Stock Market Investing Strategy for 2009.
a. 2009 will be great time to scale into long-term investments at bargain basement prices. Even if stocks fall towards the worse case scenario, that should be more than made up for in subsequent years as great bull markets are born out of the most pessimistic market conditions! My October strategy called for a 10% per month investment of funds allocated for stock market investing on each month where the index trades to below 10% from its low to date. The October article also listed the key mega-trends to focus on such as Global Warming, Peak Oil, Rise of Asian Middle class and Population growth as the sectors to focus on that are expected to outperform the general indices over the long-run.
b. 2009 Will be just as great a year for trading the markets as was 2008, and in that respect my new site walayatstreet.com will be aimed at position trading, including hedge fund style trading tactics, the site will aim to freely share my whole trading methodology honed over the past 20 years AND to publicise trade points and ongoing analysis. The site will be going live shortly, in the meantime the site lists my existing longer range analysis and commentary.
Remember - STOCK MARKETS MOVE AHEAD OF THE ECONOMIC DATA AND NEWS, Therefore Focus on the Trend rather than the Bad News of which there will be plenty during 2009 as global economies contract.
By Nadeem Walayat
http://www.marketoracle.co.uk
Copyright © 2005-09 Marketoracle.co.uk (Market Oracle Ltd). All rights reserved.
Nadeem Walayat has over 20 years experience of trading derivatives, portfolio management and analysing the financial markets, including one of few who both anticipated and Beat the 1987 Crash. Nadeem's forward looking analysis specialises on the housing market and interest rates. Nadeem is the Editor of The Market Oracle, a FREE Daily Financial Markets Analysis & Forecasting online publication. We present in-depth analysis from over 250 experienced analysts on a range of views of the probable direction of the financial markets. Thus enabling our readers to arrive at an informed opinion on future market direction. http://www.marketoracle.co.uk
Disclaimer: The above is a matter of opinion provided for general information purposes only and is not intended as investment advice. Information and analysis above are derived from sources and utilising methods believed to be reliable, but we cannot accept responsibility for any trading losses you may incur as a result of this analysis. Individuals should consult with their personal financial advisors before engaging in any trading activities.
Attention Editors and Publishers! - You have permission to republish THIS article. Republished articles must include attribution to the author and links back to the http://www.marketoracle.co.uk . Please send an email to republish@marketoracle.co.uk, to include a link to the published article.
Nadeem Walayat Archive |
© 2005-2022 http://www.MarketOracle.co.uk - The Market Oracle is a FREE Daily Financial Markets Analysis & Forecasting online publication.
Comments
|
Narco
23 Jan 09, 18:35 |
A Long Term Bull?
What makes you so sure the bottom in 2009 is the start of a long term bull market? ? Bob Prechter believes the stock markets are at the top of a grand supercycle according to his version of the Elliot Wave principal. Another reason to believe stocks are set to fall is the debt to GDP ratio which should fall considerably back towards 100%. http://contreinfo.info/IMG/png/debt_pib.png If you are expecting hyperinflation then surely gold and silver are the only assets of choice? |
|
|
Nadeem_Walayat
23 Jan 09, 21:14 |
FTSE Bull - sort of....
The forecast is for a decline into mid 2009 targeting a low of 3,400 from which I expect a 35% bounce, for which at this time I have a 70% confidence of occuring. Yes, this decline presents opportunities in certain sectors, and suggests a multi-year bull market, REMEMBER that the secular bear market since 2000, contained a multi-year bull market from 2003 to 2007. This analysis is continuation of that which was posted in october as linked above, that concluded that there will be no great depression 2, rather a severe recession, therefore my expectations are not of a bear market on the scale of the 1930's. Robert Pretcher has made his call which is fine, my call is mainly for 2009, and its a long way to 2010.... However these grand super cycle final 5ths have cropped up many, many times before, ;) Looks like its been conveniently forgotten by most, but Prechter wrote a book in 1994 "Crest of a Wave" that the Dow would peak at 4000 and then fall by 90% to 400. Oh something about a 100 year bear market was in there too. So did those that followed this perma bear stuff make anything during the biggest bull market in history ? Back to the present, I am accumulating in this bear market so to speak putting my money where my mouth is. Gold may rise, in fact the gold forecast is bullish at least into March, but its not cheap, what is cheap is crude oil, though it has recently risen from $33, but each dip back into the lows $30's is THE opportunity of the recession similarly if the high dividend oil stocks follow, though they have been more resliant. In fact today, oil is at $46, thats a near 50% rise in price ! whereas gold appears to be up about 12%, which confirms my strategy.... HYPERINFLATION - Is not a certainty and a worst case scenerio, the most probable outcome is stagflation as I have mentioned many times, it depends on what the government does over the next 12months as actions by design or forced upon it COULD trigger hyper inflation, such as taking on £5 trillion of banking sector liabilities, which would crash sterling and hence hyperinflation. Best, |
|
|
NASIR
15 Feb 09, 13:47 |
FTSE RALLY
I have spotted the potential formation of a series of divergences which could mean the cyclical bear in a secular bear market is coming to an end, only way of knowing for sure is if ftse makes a new low, that would allow clearer scrutiny of chart patterns. The worlds greatest traders all agree that divergence is a leading indicator hence divergence signals will show us the end is near. There is also ichimoku of course, the great thing is those is the know will make huge amounts of money and those who listen to the news will miss the boat. goodluck and be greedy when others are fearful. not greedy when your best mate is recommending shares or telling you how the ftse has now reached an all time end, that my friend is the end. I believe nadeem knows what im on about. |
|
|
Nadeem_Walayat
09 Sep 09, 12:58 |
FTSE 100 Hits 2009 Stocks Bull Market Target of 5000, What's Next?
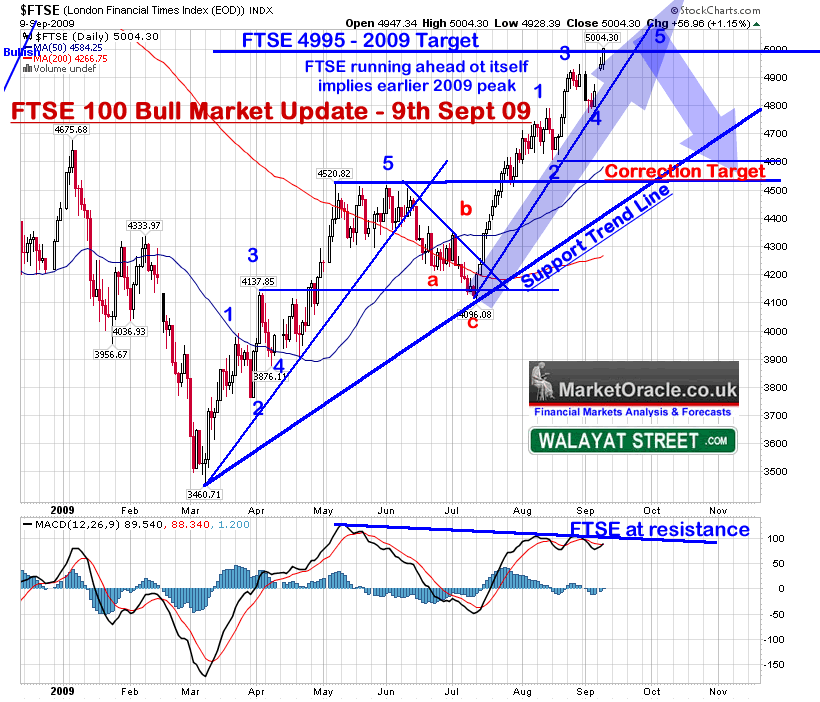
FTSE 100 Bull Market Update 9th September 2009 The FTSE 100 stock market index broke above 5,000 by closing at 5,004 for the first time since the financial collapse of September 2008. Whilst the highly vocal public perma bears have frightened much of the investing public into sitting on the sidelines, too frightened to commit and leaving the smart money to accumulate at rock bottom prices, readers following my analysis of the stealth stocks bull market will have been left with little doubt of where I expected the market to head with first a clear target for the bear market bottom at the start of the year confirmed in March, and then the subsequent stealth bull market mapped out throughout 2009 as the following illustrate before I get to where I expect the FTSE is headed to next. Whilst much of my analysis has been focused on the Dow Jones Index, however as I have stated several times over the year that the FTSE would closely track the DJIA in terms of market timing, but with a more positive trend advantage to the Dow Jones Index. FTSE 100 Index Forecast (20th Jan 09 - FTSE 4091)
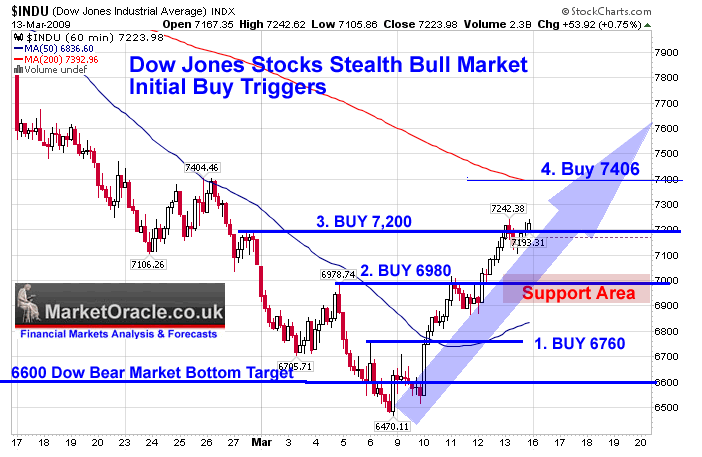
"The FTSE looks set to break below the previous low, however I expect the FTSE to outperform other indices with a minimum 35% move from the years low and finish Up on the year, my best estimate at this time is for the FTSE to trade at 4,600 or higher during December 2009. Also I am expecting that 2009 will mark the start of a multi-year bull market that will eventually make 2008-2009's price action appear as a mere minor blip, much as the 1987 crash appears on today's price charts." Dow Jones Index Bottom? - 8th March 2009 - DJIA 6626, FTSE 3520 "Having now fulfilled the primary target of 6,600 the next phase of the strategy is therefore towards accumulating on buy price triggers in advance of what I consider will become a multi-year bull market, which appears contrary to many analysts." Dow Jones Stealth Bull Market Born - 15th March 2009 - Dow 7224, FTSE 3,770
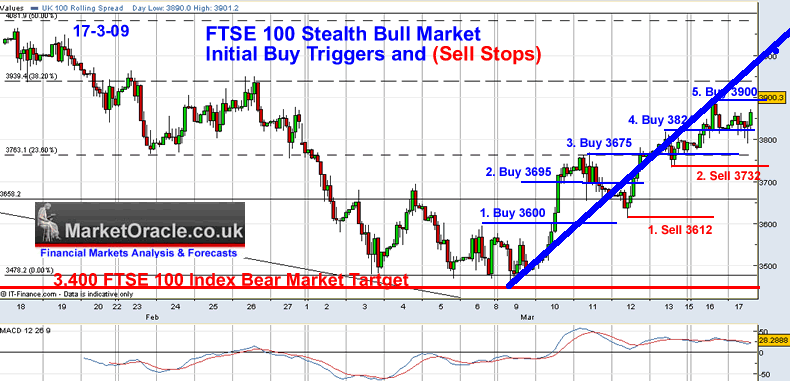
"As stated in last weekends analysis and newsletter , following the Dow's Friday close at 6626 that the Dow Jones Index had now fulfilled its bear market target of 6,600 as per the analysis of 20th Jan 2009 and illustrated by the chart below. The primary focus hence forth was to "position for a bullish spike higher" that would CONFIRM the bear market low, and negate the secondary far less probable overshoot target of 5,700 to 6000. This occurred on Tuesday which saw the first of a series of BUY TRIGGERS both on the Intra day charts and then on the Daily time frame chart that confirmed the preceding weeks Bear Market Low and set in motion the anticipated spike that took the Dow up 12% by the end of the week to close at 7,224. " FTSE 100 Index Stealth Bull Market as Bear Market Bottoms at 3,460 - 17th March 2009 - FTSE 3860
Initial Bull Market Target 30% Advanced, revised during April Dow analysis to 50% for 2009 or FTSE 4995 More Recent Dow Analysis mapped out the trend for the Dow Jones Index as follows - The stocks bull market continues to resolve towards the pattern I painted some 7 weeks ago - Vicious Stocks Stealth Bull Market Eats the Bears Alive!, What's Next?
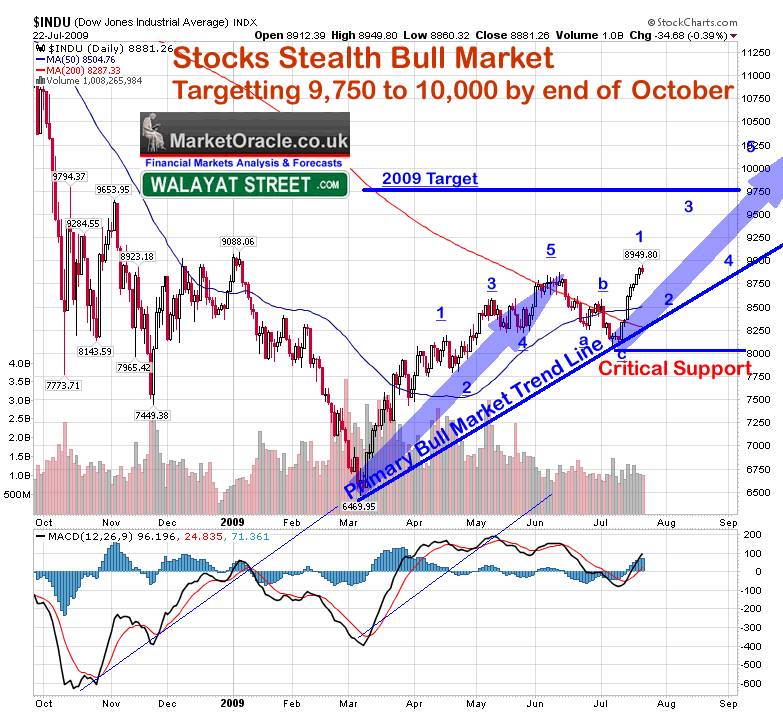
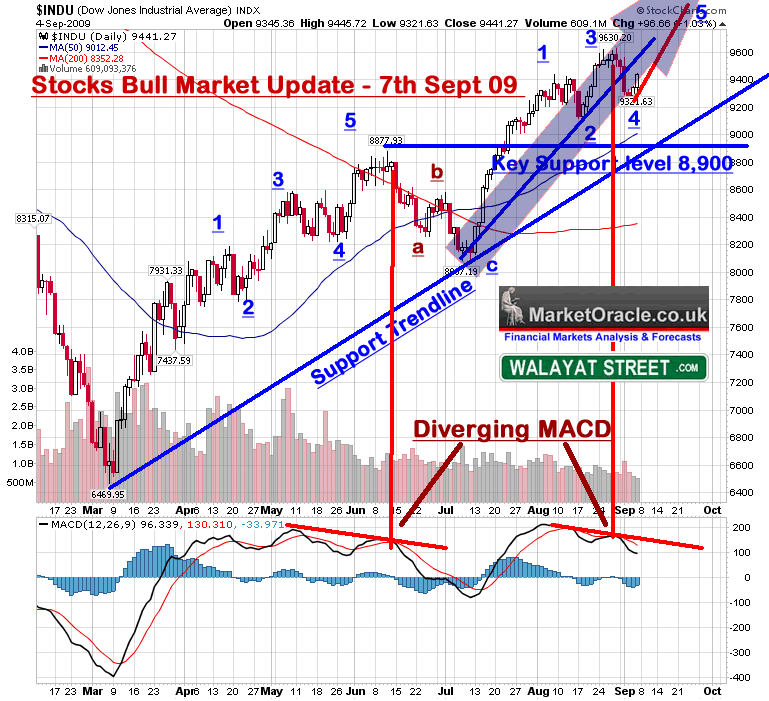
CONCLUSION - My earlier fears about a bull trap appear to be unfounded, the stock chart is talking that we are in a stocks bull market, and is suggestive of a trend higher towards a 2009 target of between 9750 and 10,000, with a high probability that we may get there before the end of October!. Key danger areas for this scenario are a. for the trend line to contain corrections, and b. that 8080, MUST HOLD. The last update of 3 weeks ago (Stocks Stealth Bull Market Crushes Bears Hopes Again) showed the trend resolving towards an earlier peak given the strength of wave 1 which implied a weaker waves 3 and 5.
The Price action to date has shown relative strength against the forecast of a month ago, this suggests a higher target than the original 9750 to 10K before the end of Oct 2009, the secondary stated target was 10,450. However it also suggests that the market may put in an earlier peak. I am still leaning towards the next correction AFTER the peak to be of greater significance than the last correction from June to July. Also, whilst my in depth economic analysis is on the UK economy, however much of the conclusions could equally be applied to other western economies, the analysis of February 2009 has been projecting towards a a DOUBLE DIP recession (updated June 09) which has negative implications for stocks during 2010, but for now DON'T be silly, don't fight the stocks bull market (time to drop the word stealth). The Crumbliest Flakiest Stocks Bull Market Never Tasted Before - Sept 7th 2009
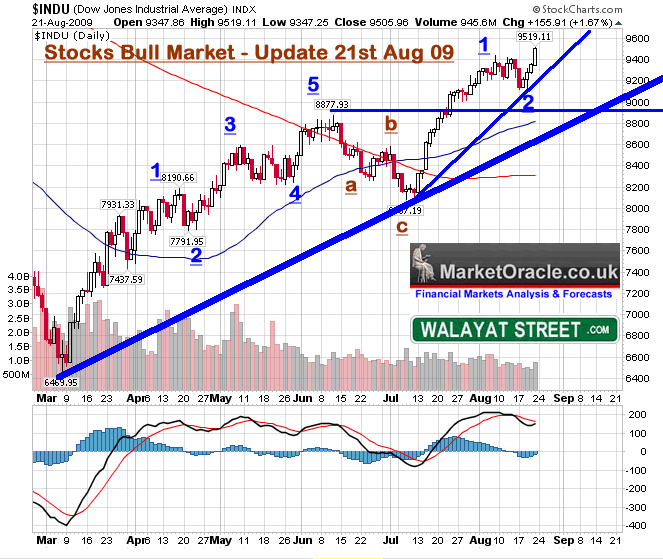
The target for the termination of the current phase of the bull market rally was between 9750 and 10,000. As mentioned above, I am not expecting an easy ride for the fifth wave as clearly it is an obvious pattern to interpret following waves 1,2,3,4. What does this mean ? Well wave 3 is screaming weakness, so that suggests a weak push higher rather than something that resembles wave 1. The MACD is also signaling serious price weakness as there is clear divergence taking place between the rising trend and a falling MACD, very similar to the June peak. Two possible outcomes - a. That the fifth puts in a lower peak than the wave 3, which is significantly more bearish. b. That we get some sideways drift (possible false break lower) before a sharp rally for a higher fifth into the target zone. Despite the increasingly bearish technical indicators at this point I continue to march with the bull market and favour outcome b. ahead of a more serious correction that would first 1. target target the main support trendline and 2. 8900 Previous Peak. FTSE 100 Index, Where Next?
The FTSE 100 index as originally anticipated at the start of the year is showing relative strength against the Dow Jones, this is most evident in the fact that the FTSE has achieved its price target for 2009 of 5,000 ahead of schedule by several weeks, whereas the Dow Jones remains several hundred points short of its target range of between 9,750 and 10,000. The elliott wave pattern shows that the FTSE has broken above the wave 3 peak and is into its final fifth towards a new high which is ahead of schedule against a projected termination point for this rally of early October. What this suggests is that the FTSE could drift sideways for several weeks waiting for the DJIA to play catchup i.e. I see very limited upside remaining in the FTSE for the rest of this year! In fact the FTSE is primed to undergo a serious correction the timing of which will be on alignment with other major global stock indices i.e. the DJIA. Therefore I anticipate a much more difficult time for the FTSE for the rest of the year, i.e. Despite being a stocks bull, I would be surprised if the momentum of the past 2 months continues. More Probable is that the FTSE will undergo a serious correction towards a target of 4,500 to 4650 as indicated by the above chart. In Summary, the FTSE 100 Index has FULLFILLED ITS 2009 Bull market Target of 5,000 and is primed for an IMMINENT SERIOUS CORRECTION, the only delay of which is in alignment with other global indices. Your stock index trading analyst. Ensure you are subscribed to my always free newsletter to be kept upto date on the stocks bull market. By Nadeem Walayat Copyright © 2005-09 Marketoracle.co.uk (Market Oracle Ltd). All rights reserved. Nadeem Walayat has over 20 years experience of trading derivatives, portfolio management and analysing the financial markets, including one of few who both anticipated and Beat the 1987 Crash. Nadeem's forward looking analysis specialises on the housing market and interest rates. Nadeem is the Editor of The Market Oracle, a FREE Daily Financial Markets Analysis & Forecasting online publication. We present in-depth analysis from over 300 experienced analysts on a range of views of the probable direction of the financial markets. Thus enabling our readers to arrive at an informed opinion on future market direction. http://www.marketoracle.co.uk Disclaimer: The above is a matter of opinion provided for general information purposes only and is not intended as investment advice. Information and analysis above are derived from sources and utilising methods believed to be reliable, but we cannot accept responsibility for any trading losses you may incur as a result of this analysis. Individuals should consult with their personal financial advisors before engaging in any trading activities.
|


