


Stock Market, What's Next? Another Leg Down, or Rally?
Stock-Markets / US Stock Markets Jan 23, 2009 - 05:39 PM GMTBy: Marty_Chenard

 Most investors only look at what is happening to the "Broad Market".
For instance, tracking the action of an index such as the S&P or the NASDAQ is an observation of broad-market action because you are looking at the composite action of all the stocks within each index.
But, within an index there are many things stirring around ... not seen by the average investor.
Let's create 4 categories of stocks for any index based on Relative Strength.
Those categories will be:
1. Very Strong Stocks
2. Very Weak Stocks
3. Strong Stocks, and ...
4. Weak Stocks.
The key distinction for these categories is the " Very " Strong/Weak categories because they measure what is happening on the "extreme ends" of a "universe of stocks". What's in the middle behaves as the "average behaviour" of the group.
How can you predict the future change of "an average" if you are measuring the "change of the average" itself. In observing a "change", are you not really observing a change that was induced by another "element or subset" within the original group?
A better question is, "What moves the average of a group in a different direction?"
Is it not the change of the leaders within the group?
Imagine that you have a rope pulling contest with 50 men on each side. There are 4 groups of men on each side. The Strong and Weak men offset each other. So there are only the Very Strong and Very Weak men left to make the difference in deciding which side has the advantage ... and which side will win.
All it would take for all 50 men on one side to lose the battle, is for the other side to have 1 more Very Strong man than the other side.
So why not measure the change of balance of the Very Strong vs. Very Weak stocks on an index to see how the average will end up changing?
So that is what we will look at today ...
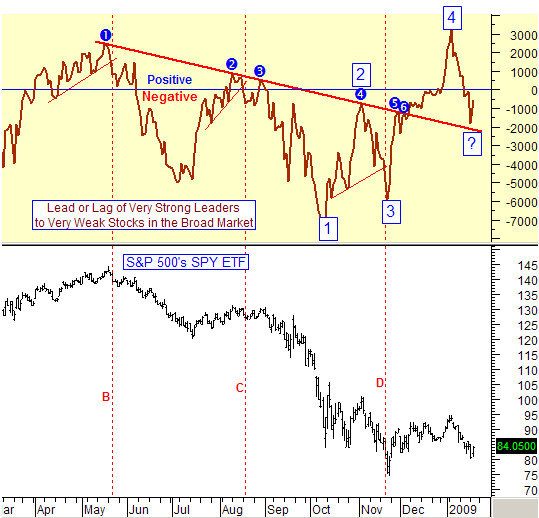
Everyday, we measure the trend of how many stocks are reaching Very Strong or Very Weak status on a daily basis. Then, to see which group has the upper hand, we measure the Difference between them. To get the difference, we divide how many Very Strongs there are relative to how many Very Weaks there are ... so we subtract the Very Weaks from the Very Strongs and post that number and call that number the Net Daily Difference in the chart below.
How to read the chart:
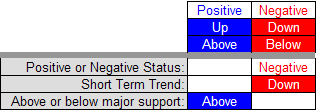
1. When the number is Positive, there are more Very Strong Leaders than Very Weak Stocks.
2. When the number is Negative, there are more Very Weak Stocks than Very Strong Stocks.
Also, take the trend direction into consideration. If the indicator is in Negative territory but moving up on higher/highs and higher/lows than that up trending will have a positive bias on the S&P.
So, below is the data going back to last March. Observe what happened to the S&P when the Lead/Lag Indicatory was positive. Observe what happened to the S&P when the Lead/Lag Indicator was Negative ... BUT trending higher toward positive territory. The observe the opposite conditions.
Two things should be apparent ... that a Positive or Negative status is important, and that the directional trend is important.
Okay ... so, where are we now?
Not a simple answer, is it?
We have two short term negative conditions, but one longer term positive condition.
*** Bias is short term negative, but longer term, the Major Support is still holding. As long as the Major Support holds, the market will avert taking another downside leg.
What's ahead ... another leg down, or a possible Rally?
Remember that an up trend is defined as a condition where higher/highs and higher/lows are being made. Now look at numbers 1 to 4 in the boxed in areas.
They fit the definition of an up trend. If the current box with a question mark holds and moves up, it will become a higher/low and the trend will continue with the added advantage of the Lead/Lag indicator being in positive territory by that time.
So, that is what is happening behind the noise in the stock market . Unknown and unseen by most investors, there is a basing foundation trying to be established that has positive implications just down the road ... if this indicator can continue on its journey of making higher/highs and higher/lows.
[Today's chart is posted as a courtesy. It is posted daily on our paid subscriber site and out of fairness to our paid members, we will only post this chart occasionally on this free site.]
*** Feel free to share this page with others by using the "Send this Page to a Friend" link below.
By Marty Chenard
http://www.stocktiming.com/
Please Note: We do not issue Buy or Sell timing recommendations on these Free daily update pages . I hope you understand, that in fairness, our Buy/Sell recommendations and advanced market Models are only available to our paid subscribers on a password required basis. Membership information
Marty Chenard is the Author and Teacher of two Seminar Courses on "Advanced Technical Analysis Investing", Mr. Chenard has been investing for over 30 years. In 2001 when the NASDAQ dropped 24.5%, his personal investment performance for the year was a gain of 57.428%. He is an Advanced Stock Market Technical Analyst that has developed his own proprietary analytical tools. As a result, he was out of the market two weeks before the 1987 Crash in the most recent Bear Market he faxed his Members in March 2000 telling them all to SELL. He is an advanced technical analyst and not an investment advisor, nor a securities broker.
Marty Chenard Archive |
© 2005-2022 http://www.MarketOracle.co.uk - The Market Oracle is a FREE Daily Financial Markets Analysis & Forecasting online publication.