


China ETF Funds Investment Focus: FXI, GXC, PGJ
Stock-Markets / Chinese Stock Market Feb 08, 2009 - 09:42 AM GMTBy: Richard_Shaw

 China was, is and will be an important investor focus country. Three exchange traded funds are FXI (by Barclay's), GXC (by State Street) and PGJ (by Invesco/Powershares).
Let's see how they compare, and what one might decide about taking risk on China at this time.
Benchmarks:
The funds are based on quite different indices, as follows:
FXI — FTSE/XINHUA China 25 Index : This market-cap based index consists of 25 companies representing the largest 25 Chinese companies comprising H Shares and Red Chips, ranked by total market capitalization. Index constituents are capped at 10% of the total index.
PGJ — Halter USX China Index : This modified market-cap Index consists of 103 companies whose common stock is publicly traded in the United States and the majority of whose business is conducted within the People's Republic of China. The market-cap modification uses a formula that fundamentally prevents the largest market-cap companies from becoming too large a component of the index.
GXC — S&P Citigroup BMI China Index : This market-cap weighted index consists of 342 companies which are publicly traded and domiciled in China, but legally available to foreign investors.
Performance Charts:
Even though the indices the funds follow are different, their performance is not as different as the descriptions of their indices might suggest.
FXI, GXC, PDJ, FTSE/Xinhua 25 Index, and Halters USX China Index
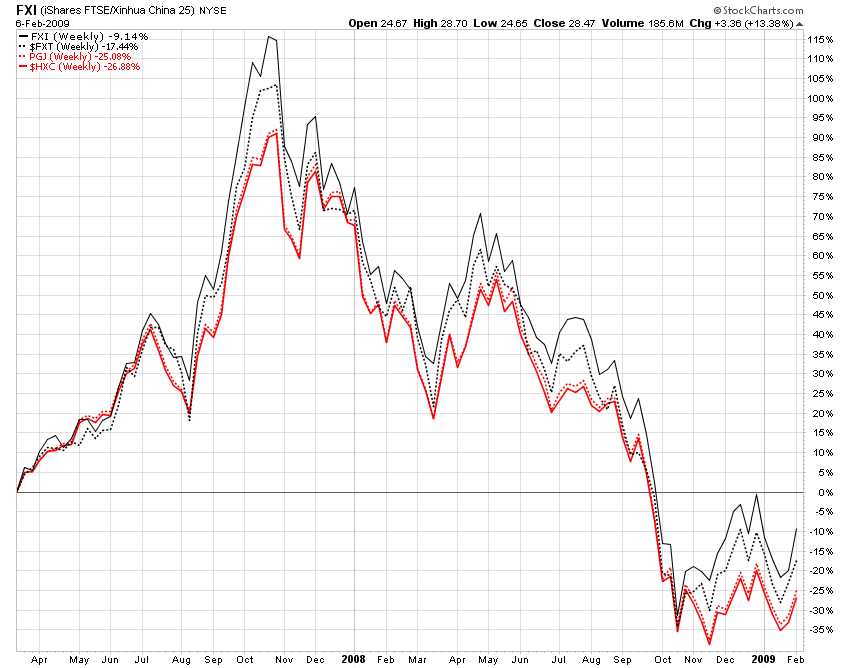
The StockCharts.com tool does not have data for the S&P CITI/BMI China Index. The index appears to be a customized for the ETF. It is not published or described on the S&P indices website, and discussion with SSGA staff indicated that it is specific for GXC.
Fund Attributes:
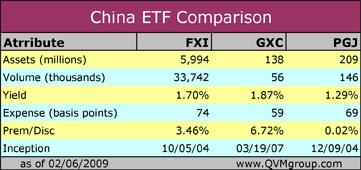
Practical Choice:
Given that the performance of each ETF is quite similar, and that the assets and share volume of FXI are far greater than for GXC and PGJ, we believe that FXI is a superior choice for active accounts or large accounts that require good liquidity and execution.
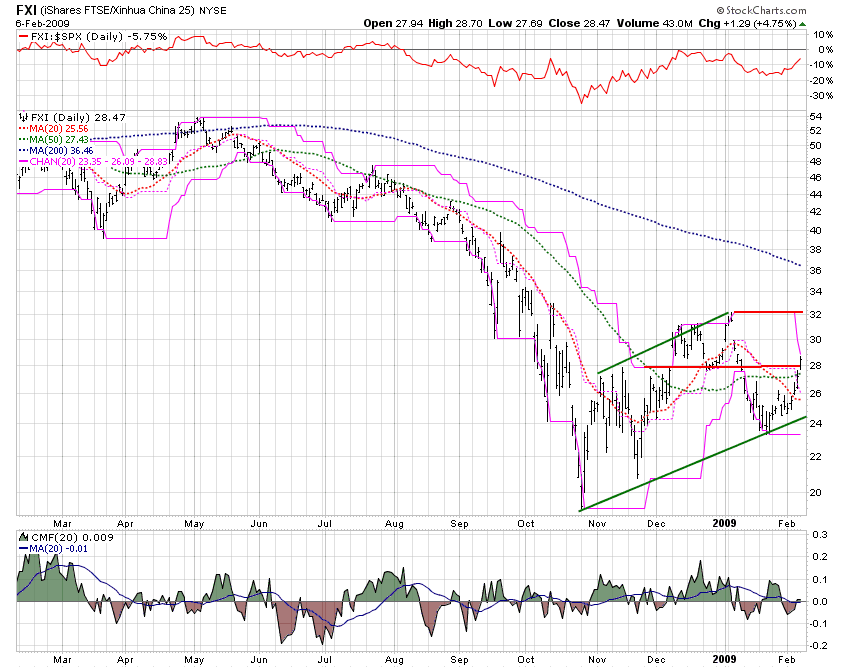
Detailed FXI Chart:
This FXI one-year daily bar chart shows that the relative strength of China stocks versus the S&P 500 is close to parity but still a bit behind (top frame). The money flow is not showing trend (bottom frame). The price is turning up in the very short-term, and has pierced one resistance level (longer horizontal red line), yet has another important resistance level ahead (shorter red horizontal line). There is a pattern of rising bottoms and rising tops (green diagonal lines).
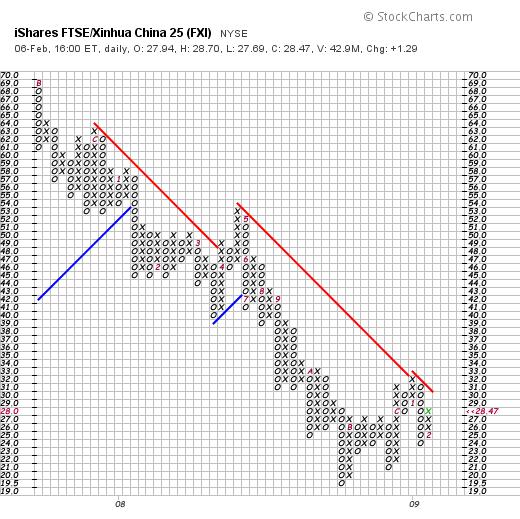
This point & figure chart shows a continued down trend, as well as rising bottoms and rising tops.
Fundamentals:
The global fundamentals, to which China is sensitive are very bad. These words from the IMF should give pause on stock commitments generally:
Feb. 7 (Bloomberg) — Advanced economies are already in a “depression” and the financial crisis may deepen unless the banking system is fixed, International Monetary Fund Managing Director Dominique Strauss-Kahn said.
“The worst cannot be ruled out,” Strauss-Kahn said in Kuala Lumpur, where he was attending a gathering of central bankers from Southeast Asia. “There's a lot of downside risk.”
Ten days ago, the IMF cut its world-growth estimate for this year to 0.5 percent, the weakest pace since World War II.
On the other hand, the country is still growing while the world is nearly shrinking:
Feb 6 (China Daily) – China may have surpassed the United States to become the world's largest auto market based on monthly sales in January, according to analysts and forecasts.
General Motors, the leading US automaker, estimates that China sold about 790,000 vehicles last month.
Nonetheless, China is slowing down and experiencing difficulties:
Feb 6 (China Daily) – According to a report by China Economic Monitoring and Analysis Center, over 90 percent of the 100 economists surveyed expressed the view that the growing number of jobless is the top challenge for the economy, followed by economic slowdown and social instability.
The survey, conducted in December, also revealed that economists' confidence in the economy has dropped to its lowest since 2004, when it was first introduced.
… The rising concern over unemployment also underscores the gloomy prospects of the nation's job market. Over the past few months, more than 20 million migrant workers, or a sixth of the total, have lost their jobs due to the economic slowdown.
Policymakers also forecast the registered urban unemployment rate, which excludes migrant workers, will hit 4.6 percent in 2009, up from 4.2 percent in the fourth quarter of 2008.
China's economic growth dropped to 9 percent in 2008, compared with 13 percent of 2007. The International Monetary Fund has predicted that the nation's growth would further decline to 6.7 percent this year, far below the long-time 8 percent target of the Chinese government.
… More than 70 percent of the economists surveyed believed that the Chinese economy would continue to lose steam this year with the lowest point likely to occur in the second quarter. Three-fifths of the economists said the global economy would only start to recover in 2010.
Resistance, Support, and Possible Appreciation:
Both the bar chart and the point & figure chart show resistance at about $32 and support at about $23 (the price is near $28.50).
There are about 22 points from 32 to the high of 54 recorded about nine months ago (about 68% above 22). There are about 26 points above the current approximate price of $29 (about 90% above 29).
The daily price fluctuation has decreased to between $1.50 and $1.25 since Q4 2008, which is still a bit wide.
A fall to support at $23 would create a loss of about (8+%) from the current level.
Opinion:
An aggressive investors might re-enter China via FXI at this time, with trailing stop loss orders. However, a more cautious investor might wait for a price above $32, which is above next resistance level.
Of course, even if FXI breaks $32, there is no guarantee a reversal would not soon follow.
If the fundamentals were prospectively encouraging, we might be attracted by the current price move, but given the adverse news and economic prognostications, we would prefer to see the price above the next resistance level at $32 before taking trading risk on China.
Markets climb a wall of worry, and grow on skepticism. Maybe we are just worried, skeptical and too cautious. However, using a football metaphor, we prefer broken field running, which comes after $32.
By Richard Shaw
http://www.qvmgroup.com
Richard Shaw leads the QVM team as President of QVM Group. Richard has extensive investment industry experience including serving on the board of directors of two large investment management companies, including Aberdeen Asset Management (listed London Stock Exchange) and as a charter investor and director of Lending Tree ( download short professional profile ). He provides portfolio design and management services to individual and corporate clients. He also edits the QVM investment blog. His writings are generally republished by SeekingAlpha and Reuters and are linked to sites such as Kiplinger and Yahoo Finance and other sites. He is a 1970 graduate of Dartmouth College.
Copyright 2006-2009 by QVM Group LLC All rights reserved.
Disclaimer: The above is a matter of opinion and is not intended as investment advice. Information and analysis above are derived from sources and utilizing methods believed reliable, but we cannot accept responsibility for any trading losses you may incur as a result of this analysis. Do your own due diligence.
Richard Shaw Archive |
© 2005-2022 http://www.MarketOracle.co.uk - The Market Oracle is a FREE Daily Financial Markets Analysis & Forecasting online publication.