


US Dollar Shines in a Depression as China buys Metals
Currencies / US Dollar Mar 05, 2009 - 10:19 AM GMTBy: Gary_Dorsch

 “De-leveraging” and “Risk Aversion” are the buzzwords cited by many currency analysts, to explain the puzzling strength of the US-dollar, which has climbed by more than 20% since last July, despite the widely held view, that top Wall Street banks are insolvent and only surviving on artificial life support, and with the flow of credit badly constrained, the US economy is spiraling towards a “Great Depression.”
De-leveraging in the $4-trillion per day foreign exchange market generally refers to the unwinding of speculative “carry trades.” The enormous fortunes of Wall Street's aristocracy were built-up on the leveraging of debt, including “carry-trades,” in order to buy exotic securities built around sub-prime mortgages, and other instruments of financial speculation. But when the US sub-prime mortgage crisis hit in the summer of 2007, traders began a massive de-leveraging process, or selling risky assets and buying back US-dollars and Japanese yen to pay back loans in those currencies.
When global stock markets are plunging - the risk barometer shoots up, and carry traders scramble to close out losing trades, and will buy-back the funding currency even if it offers a near zero-percent yield. Last year, the Japanese yen rose against all major currencies, even though Japan 's economy was collapsing at twice the speed of the US-economy's demise, and the Nikkei-225 stock a record 42-percent.
 But after a year and a half of unwinding, the vast bulk of $1.5-trillion yen carry trade has probably been extinguished. Japan 's mom-and-pop retail investors have also reduced their short yen positions versus higher yielding currencies, from 7-trillion yen in 2007 to 740-billion yen today. Indeed, since February 1 st , the US-dollar has done a U-turn against the yen, climbing 10% higher to 99.6-yen this week.
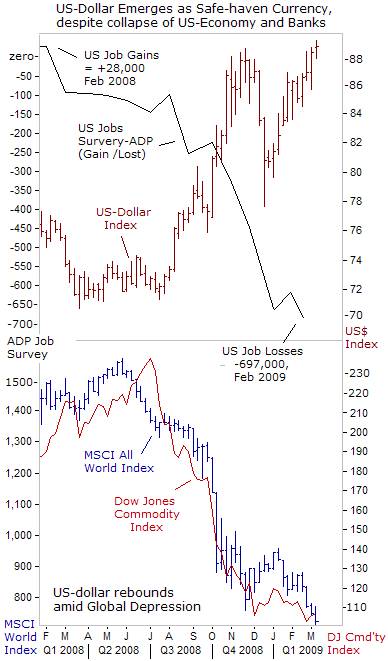
The unwinding of risky positions in global commodities and stocks, coincided with the resurgence of the US-dollar against a basket of currencies, heavily weighted toward the Euro, (reflecting the Euro-zone's importance to US- trade). The US- dollar index almost reached the psychological 90-level this week, from around the 72-level last July, marching higher, even as the Dow Jones Industrials fell 11.7% in February, its worst performance since 1933, at the height of the Great Depression. According to this view, an enormous US-dollar carry trade is still in process of unwinding.
The Dow Industrials have plunged below 7,000-points to the lowest in 12-years, following reports that the hedge fund manager AIG lost $61.7-billion in the last quarter of 2008, General Electric plunged to $6 /share, with $475 billion of outstanding debt, and General Motors is near Chapter 11. Yet all the troubles on Wall Street failed to tarnish the dollar's appeal among foreign central banks, who still view the guarantee of the United States government as a sure bet, and bought more than a third of the Treasury's debt auctioned in February.
The staggering loss of 1.3-million US-jobs so far this year, hasn't knocked the dollar off its upward trajectory, perhaps due to a lack of better alternatives. Exports from Japan and other Asian powerhouses have quickly collapsed at a staggering pace due to the global downturn. Interest rate spreads in the Euro-zone bond markets are diverging to their widest levels ever against the German bund, amid warnings of the possible bankruptcy of weaker Euro-zone states. There has also been speculation of a potential breakup of the European currency union, - the Euro itself.
The Euro has suddenly become a risky currency, since the financial crisis in Eastern Europe could rival the destructive power of the US sub-prime debt bomb. Western European banks have an estimated €1.6 trillion extended in Eastern Europe , two-thirds denominated in Euros and Swiss francs, to borrowers whose incomes are paid in Hungarian forints and Latvian lats, and stretched to the limit.
 The Polish zloty has dropped 29% against the Euro, the Hungarian forint is 20% lower, the Romanian leu down 17% and the Czech koruna is 12% lower against the Euro, since the September collapse of Lehman Brothers, making their debts unaffordable and subject to default. Emerging European currencies plunged on March 2 nd , led by a 2.5% drop in the Hungarian forint, after a summit of European Union leaders rejected a 180-billion euro bailout plan for the region.
The EU summit participants were unable to agree on any concrete measures to deal with the European credit crunch, the much-feared collapse of east European banks, or a pan-European stimulus program. Hungarian president Ferenc Gyurcsany warned that failure to offer bigger bailouts “could lead to massive contractions in eastern economies and large-scale defaults that would affect Europe as a whole.” The result, he continued, would be increased political unrest and immigration pressures.
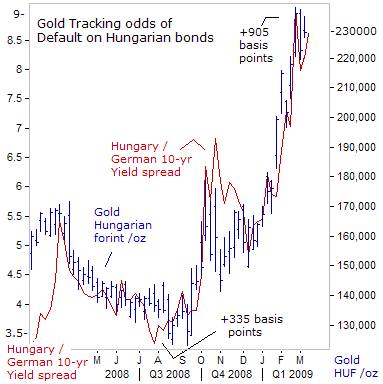
As such, investors have turned to gold as a “safe-haven” hedge against the possible default by Western European banks or emerging nations on their outstanding debt. Since July, the yield on Hungary 's 10-year bond has soared from +334-basis points over the German bund, to +844-bp today. Likewise, Gold has been closely tracking the yield spread, reaching a record 230,000 Hungarian forints /oz last week.
But simply adopting counter-intuitive logic, - that negative data on the US-economy is bullish for the dollar, still leaves the currency trader without the key explanation as to why a depression is bullish for the greenback. However, the secret was revealed in a special focus report published by Global Money Trends on January 13 th , and will be highlighted again in the upcoming Feb 6 th edition, with updated forecasts.
US$ Skyrocketing against Korean won
South Korea 's foreign exchange authorities sold an estimated $1 billion to cap the dollar's explosive surge this week, after it hit a 12-year high of 1,595 Korean-won. The US-dollar is up a staggering 55% versus the Korean-won from a year ago, despite central bank sales of $42-billion from its FX stash. Foreign investors are dumping Korean stocks, due to worries about the nation's ability to service short-term external debts and a collapse in exports, which are adding to market jitters.
Korea's external borrowings maturing within one-year totaled $194-billion at the end of December, equaling 96.5% of the nation's $201-billion of foreign currency reserves, suggesting Asia's fourth-largest economy can barely repay its short-term external debt. In an environment of elevated risk aversion, Korea 's ratio of foreign exchange reserves to short-term external debt is not high enough to insulate the Korean won from contagion sales.
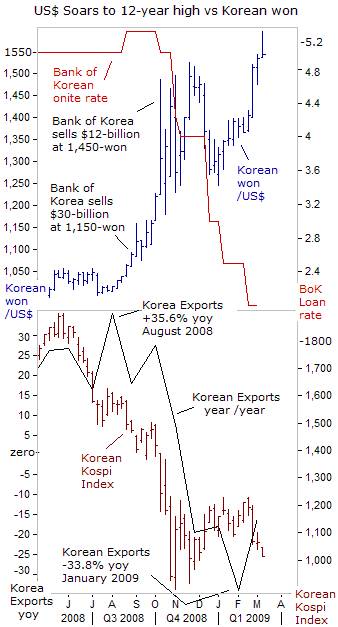
Concerns about the health of the US-banking industry and the deteriorating economic conditions in Eastern Europe are denting market sentiment further. Korea's industrial output contracted 25.6% in January from a year earlier, plummeting further from an 18.7% fall a month earlier, indicating that Korea's tiger economy is slipping into a deeper recession. This was the fourth consecutive month of decline since October and the worst in 40-years.
Factories operated at just 61.5% of capacity in January, the lowest level since September 1980, and a sharp 30% fall in imports in February, underlined doubts that demand would pick up. Like other Asian exporters, South Korea has been hit hard by the slump in global demand. Goods sold abroad fell to $25.8-billion in January, or 24% less than a record $41-billion in July. Domestically, retail sales dropped 3.1% despite falling consumer prices, as more consumers tightened their purse strings on the tight job market and falling asset values.
Mexican Peso in Crisis as Oil Revenues Sink,
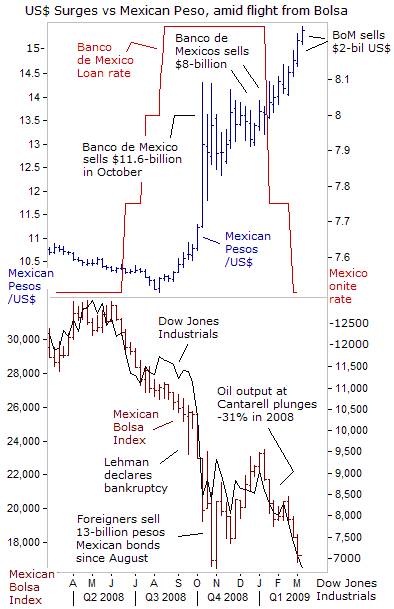
It was just last summer that the Mexican peso was on a hot streak , reaching a six-year high of 9.86 to the US-dollar in August. At the time, global investors were impressed with Mexico 's economy amid booming oil prices. But once the credit crunch took hold with a vengeance in September, and the global economy fell off a cliff, the peso began to nosedive, to 15.4 today, its weakest point since the currency was reconfigured in the early 1990's.
The peso has been slammed harder than many currencies because of Mexico 's heavy dependence on the US-economy, which buys roughly 85% of its exports. Mexican auto production and exports nosedived by more than 50% in January. Mexican workers in the US are also sending less money home. Mexico 's Bolsa index, including the peso's slide, is down 31.6% this year, when measured in dollars.
One factor propping-up the peso last year, - higher Mexican interest rates, is starting to fade. The Bank of Mexico lowered its benchmark short-term interest rate for the first time in nearly three-years, cutting it to 7.50% last week from 8.25% in December. The US-dollar has soared roughly 32% against the Mexican peso since September, even though the Bank of Mexico spent $20-billion of its foreign reserves since October to slow the dollar's surge, - all to no avail.
 Mexico's cash cow, - the oil reserves of Petroleos de Mexico, (Pemex), the state-owned oil company, are depleting at an alarming rate, - January oil output slumped to a more than 13-year low. The huge Cantarell oil field, was Mexico 's crown jewel for years, pumping more than 60% of the country's oil, but output has slumped by nearly two-thirds since a 2004 peak of just over 2-million bpd.
Pemex is heavily taxed to provide 40% of the Mexican government's fiscal income, but saw its sales fall to 264-billion pesos in the fourth quarter, down 17% over the year-ago period. Pemex posted a fourth-quarter net loss of 115-billion pesos ($8.3-billion) on declining crude exports, low oil prices and currency losses. Mexico 's Mayan blend fetched an average $45.60 /barrel, down 41% from the year-ago period, which helped ignite the dollar's surge above 14-pesos in January.
Investing in Mexican bonds is riskier than Brazil ' s the first time this decade, as an internal war with drug traffickers, plunging exports to the US , and a record-low peso drives away foreign investors. Five-year credit-default swaps tied to Mexico 's bonds traded at 458-basis points on March 2 nd , compared with 399- points for Brazil . In an effort to bolster the battered peso, the Mexican central bank said on March 5 th , it would sell $19-billion from reserves this year, partly with the resources of a $30-billion swap mechanism offered to Mexico by the Fed last year.
Bank of Canada Signals Eventual shift to QE
In a clear indication that the collapse of the United States economy is spreading northward, job cuts accelerated in Canada, where 129,000-jobs were eliminated in January, the highest monthly toll ever, with the unemployment rate spiking to 7.2% from 6.6 percent. Given a Canadian population of one-tenth the size of the US , the job losses was proportionately equal to 1.3-million US-workers.
In Canada , meanwhile, nearly 80% of January's job losses were among factory workers, with Ontario particularly hard-hit. While the Conservatives, with the full support of the opposition parties, were quick to commit tens of billions of dollars to propping up the banks, they had to be prodded by the opposition, the Ontario Liberal government, and Bay Street , into providing assistance to manufacturers.
Canada 's factory sector has arguably been in recession for some time, but the Canadian economy was buoyed in recent years by soaring commodity prices, especially the run-up of oil prices. However, the recent plunge in commodity prices has roiled the Canadian economy, driving down the value of the Canadian dollar towards 77 US-cents. As recently as last June, it was close to par value at $1.00.
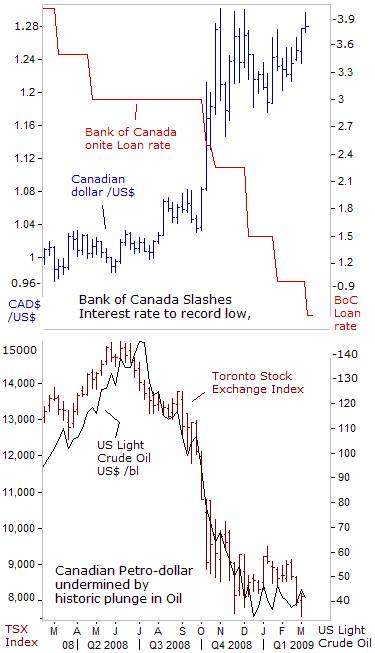 The collapse of the US economy is ravaging Canada 's export-oriented industries and their suppliers. Canada 's economy shrank at an annualized 3.4% clip, the worst performance since the first quarter of 1991, as the country posted its first trade deficit in almost 33-years in December. Canadian factory shipments plunged a record 8% in December , another stark sign of how the global crisis is biting.
Simply put, Canada 's exporters feasted for decades on ravenous American demand. With that appetite now on the strictest diet imaginable, Canada 's trade outlook has withered away accordingly. Canadian trade deficits may become a semi-permanent feature on the landscape, reflecting the impact of sharply lower energy prices, or at least until the US economy pulls out of its death spiral.
Sales of previously owned homes last month were 41% lower from a year earlier, prompting the Bank of Canada cut its key overnight rate by a half-point to 0.50%, for a cumulative reduction of 400-basis points since December 2007. Equally important, the BoC signaled for the first time that it may deploy the nuclear option, or printing Canadian dollars in order to buy corporate or government bonds. The Feb 6 th edition of Global Money Trends will focus on the Bank of England's historic shift to QE, and its implication for British gilt yields and the gold market.
Can Beijing Rescue the Global Economy?
The spectacular double-digit growth of the China economy this decade would not have been possible without the massive growth of debt in the United States and in Eastern Europe . But this growth of debt, which has sustained global demand for the longest period since World War II, has now resulted in a colossal financial crisis. At the same time, the exploitation of cheap labor in China by global industrialists, led to the destruction of four-million US factory jobs during the past eight-years.
The mirror image of America 's industrial decline was the vast expansion of financial speculation, which ultimately led to the stock market crash of 2008 and the loss of another 2.6-million jobs so far. The flow low-priced goods from Asia helped the Fed maintain a low interest rate policy, thus providing the basis for Wall Street to create ever bigger debt and credit bubbles, all in the pursuit of fabulous profits.
Meanwhile, some 26-million Chinese migrant workers have lost their jobs and 670,000 businesses have shut-down, because of collapsing export markets for Chinese-made electronics, toys, apparel, and other consumer goods. China's Politburo fears growing social unrest and there is increasing popular demand that Beijing $2-trillion FX stash be spent at home to alleviate deepening social misery.
 China has already launched a 4-trillion yuan stimulus package, equal to roughly 15% of the country's GDP. While an 8.8% economic growth rate is needed just to generate sufficient jobs for the 24-million new workers who enter the Chinese labor market each year, latest forecasts project 5.5% growth or worse in the year ahead. Thus, Beijing might decide to boost its stimulus program this year. Japan has also approved 5-trillion yen for economic stimulus, and Australia approved A$42 billion.
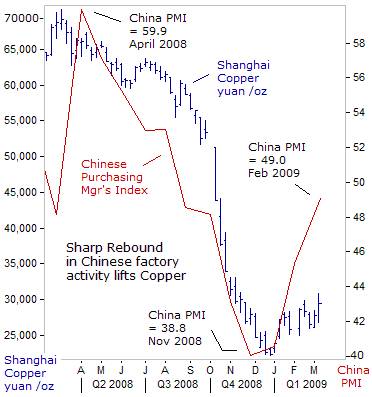
China 's official manufacturing index jumped sharply in February, gaining for the third month in a row, suggesting the country could be on the brink of a recovery despite a slump in global demand. The official purchasing managers' index (PMI), rose to 49.0 from 45.3 in January, and far above the record low of 38.8 reached in November. Every sub-index in the official PMI rose in February. Output and new orders climbed to 51.2 and 50.4, respectively, returning to mild growth.
Shanghai copper soared for a second-day on Feb 5 th to 30,310-yuan /ton, supported by the surge in the factory PMI, and speculation that Beijing would boost spending on infrastructure and manufacturing, on top of the 4-trillion yuan stimulus package unveiled in November. China 's $200-billion sovereign wealth fund, said it saw investment opportunities in the natural resources sector, lifting base metal miners.
China 's national statistics have long come under skepticism and suspicion of outside analysts, who say the country manipulates its economic numbers to mask bad news. The official PMI jumped well ahead of a similar private survey, which registered 45.1 in February . Also raising a red-flag, China said new export orders rose to 43.4 last month, a 9.7-point leap from January, which is doubtful, while the rest of the world economy was sinking deeper within a synchronized recession.
But China 's State Reserves Bureau bought 100,000 tons of zinc at 11,500 yuan /ton last week, the second purchase in less than two months, and has contracted to buy 240,000-tons of copper, and 300,000-tons of aluminum. Copper inventories at LME warehouses have declined 23,000-tons over the past two weeks, the first noticeable drop in nine-months. About 55,000-tonnes of copper are earmarked for delivery to warehouses in Shanghai , where copper supplies are at the lowest in a decade.
The February 6th edition of Global Money Trends presents a safer way to receive a double-digit return from a stable or higher copper market.
This article is just the Tip-of-the-Iceberg of what's available in the Global Money Trends newsletter, for insightful analysis and predictions of (1) top stock markets around the world, (2) Commodities such as crude oil, copper, gold, silver, and grains, (3) Foreign currencies (4) Libor interest rates and global bond markets (5) Central banker "Jawboning" and Intervention techniques that move markets.
By Gary Dorsch,
Editor, Global Money Trends newsletter
http://www.sirchartsalot.com
GMT filters important news and information into (1) bullet-point, easy to understand analysis, (2) featuring "Inter-Market Technical Analysis" that visually displays the dynamic inter-relationships between foreign currencies, commodities, interest rates and the stock markets from a dozen key countries around the world. Also included are (3) charts of key economic statistics of foreign countries that move markets.
Subscribers can also listen to bi-weekly Audio Broadcasts, with the latest news on global markets, and view our updated model portfolio 2008. To order a subscription to Global Money Trends, click on the hyperlink below, http://www.sirchartsalot.com/newsletters.php or call toll free to order, Sunday thru Thursday, 8 am to 9 pm EST, and on Friday 8 am to 5 pm, at 866-553-1007. Outside the call 561-367-1007.
Mr Dorsch worked on the trading floor of the Chicago Mercantile Exchange for nine years as the chief Financial Futures Analyst for three clearing firms, Oppenheimer Rouse Futures Inc, GH Miller and Company, and a commodity fund at the LNS Financial Group.
As a transactional broker for Charles Schwab's Global Investment Services department, Mr Dorsch handled thousands of customer trades in 45 stock exchanges around the world, including Australia, Canada, Japan, Hong Kong, the Euro zone, London, Toronto, South Africa, Mexico, and New Zealand, and Canadian oil trusts, ADR's and Exchange Traded Funds.
He wrote a weekly newsletter from 2000 thru September 2005 called, "Foreign Currency Trends" for Charles Schwab's Global Investment department, featuring inter-market technical analysis, to understand the dynamic inter-relationships between the foreign exchange, global bond and stock markets, and key industrial commodities.
Copyright © 2005-2009 SirChartsAlot, Inc. All rights reserved.
Disclaimer: SirChartsAlot.com's analysis and insights are based upon data gathered by it from various sources believed to be reliable, complete and accurate. However, no guarantee is made by SirChartsAlot.com as to the reliability, completeness and accuracy of the data so analyzed. SirChartsAlot.com is in the business of gathering information, analyzing it and disseminating the analysis for informational and educational purposes only. SirChartsAlot.com attempts to analyze trends, not make recommendations. All statements and expressions are the opinion of SirChartsAlot.com and are not meant to be investment advice or solicitation or recommendation to establish market positions. Our opinions are subject to change without notice. SirChartsAlot.com strongly advises readers to conduct thorough research relevant to decisions and verify facts from various independent sources.
Gary Dorsch Archive |
© 2005-2022 http://www.MarketOracle.co.uk - The Market Oracle is a FREE Daily Financial Markets Analysis & Forecasting online publication.