


Why Retail Stock Market Investors are Starving Themselves to Death
Stock-Markets / Stocks Bull Market Apr 03, 2009 - 07:37 PM GMTBy: Clif_Droke

 Since the market bottomed and the new cyclical recovery bull market began, retail investors have gone on a collective buyer’s strike. Call it a “hunger strike” if you will. The retail crowd is effectively starving itself by missing out on some remarkable recoveries in recent weeks and will most likely continue to miss out on these opportunity until they simply can’t take it anymore. In other words, a classic repetition of the idealized market cycle is setting up perfectly.
So why exactly are retail investors starving themselves to death by refusing to participate in this most profitable of turnarounds? Answer: Because of the most powerful of all human emotions, namely fear. The lingering fear and pessimism from last year’s abnormal market plunge put most investors in a state of catalepsy that persists even now. They are too frightened to take their capital out of zero-yielding “safe haven” investments and put that capital back to work where it is being most rewarded right now, namely equities. When will these retail traders finally work up the nerve to re-enter the market? Answer: At the top.
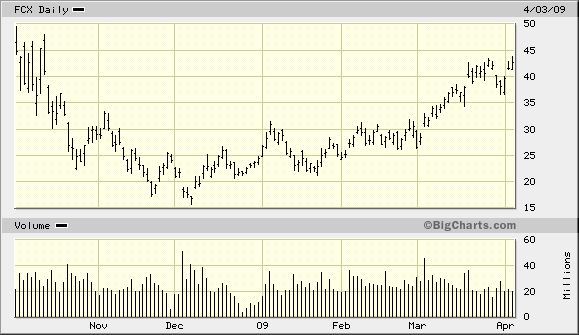
With the passage of each week the market is giving us more and more signs that a real recovery is afoot, not just for equity market for prices but for key industries and economic segments as well. For instance, several weeks ago I mentioned in this commentary that a leading indicator of industrial commodities demand, the copper price along with the price action of Freeport Copper & Gold (FCX), were pointing to increased demand from overseas. This in turn harbingers a recovery in the global economy, which bodes well for the U.S. economic recovery. Freeport’s stock price broke out of that 4-month lateral consolidation base as anticipated and has rallied nearly $15/share since the beginning of March.
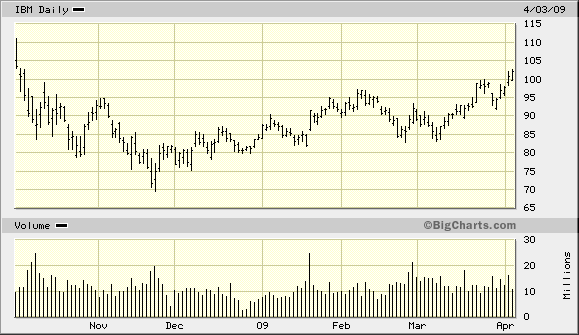
A few weeks ago I also drew your attention in this commentary to the fact that IBM, a key leading indicator for the broad market, was making a well defined series of higher highs and low which in turn presaged a major move higher for the broad market. Many readers scoffed at this notion but they aren’t scoffing now as both IBM and the S&P 500 have both plowed ahead to make significant gains since then. Once again the profit-starved retail crowd continues its self-inflicted punishment by refusing to participate in what is turning out to be one of the most profitable trading opportunities of the past one year. Even now IBM sports a nice looking chart. As an aside, IBM is an oft-overlooked leading indicator for the stock market while FCX is a valuable indicator of metals market strength.
Perhaps the most important single equities market indicator for the overall state of the U.S. business economy is the stock price of Fed-Ex (FDX). FDX had been a notable laggard during the early stages of the broad market bottoming process from October 2008 to March of this year and was a legitimate concern to some economists and analysts. Fed-Ex peaked back in July 2007 and its price action from there anticipated the economic woes of 2008. Since early March, however, FDX has staged an impressive turnaround and as of this writing (April 3) has finally closed above its key 60-day moving average for the first time in months. Trading volume in the last couple of days has been quite healthy on the upside, reflecting a return of institutional interest in this extremely important economic benchmark. Yes, even FDX is forecasting some economic recovery ahead.
For those Dow Theorist purists out there who have held out on getting bullish on the market recovery until now, the Dow Jones Transportation Average recently did something it has never done before – rally by the same amount as the Dow Jones Industrial Average, which occurred on Thursday, April 2. As discussed, leading transport stock FDX has led the way for a transportation sector recovery and even the antiquated Dow Theory is finally giving a belated signal that this market recovery has more strength than many investors give credit for.
Speaking of volume, the trading volume patterns on the NYSE have been very impressive since March and have shown in bold relief the return of the all-important institutional trading interest. Since the retail crowd was obviously not going to be the key driver in the anticipated 2009 turnaround, we knew the motive force had to come from the institutions. For most of 2008, trading volume patterns on the NYSE suggested heavy institutional liquidation (read de-leveraging) and we consistently saw enormous volume ratios, in one instance to the tune of 1:72 in terms of a downside volume ratio. This could only occur when the institutions were unloading since the retail crowd had long since sold out and headed for the hills.
For as long as the institutions were liquidating we continued to see insane downside volume ratios throughout the latter half of 2008. In the days prior to the credit crisis, a 1:13 upside/downside volume ratio was a “buy with both hands” signal that a major market bottom had been reached. We saw this at the March 2003 low, for instance. Such an extreme polarity between advancing and declining volume used to come around maybe only once every 1-2 years if not longer. Today a 1:13 up/down volume ratio, besides being a common occurrence, is a mere drop in the bucket and in some weeks represents merely “average” volume. To give you some idea of the kind of volume ratios that were prevalent in 2008 and in early 2009, below are some of the notable upside/downside volume ratios of the recent past:
- September 29: 1:72
- October 15: 1:29
- November 19: 1:52
- December 1: 1:76
- January 14: 1:30
- January 20: 1:27
- February 10: 1:33
- February 17: 1:20
These extreme volume polarities aren’t representative of the public (which can no longer be considered a serious market force). These are clearly institutional trading volumes. The fact that we’ve seen so many massive waves of liquidation showed the enormity of the institutional positions.
Since March 10, however, we’ve seen a complete reversal of this liquidation pattern. We’ve seen four days in the past month where NYSE upside volume has exceeded downside volume by a factor of at least 10:1 or greater. Here are some examples:
- March 10: 25:1
- March 12: 19:1
- March 17: 10:1
- March 23: 35:1
Have you ever seen this many “Volume Blast-off” days in such a short space? Neither have I. This record upside volume of the past month tells us that institutions have finally stopped liquidating and are willing to start putting their capital back to work instead of collecting dust it in zero-percent bonds. We know from experience that big profits are made by following what the “big boys” are doing in the stock market. Our approach since March 10 has been to follow in their footsteps and so far that strategy has paid off tremendously.
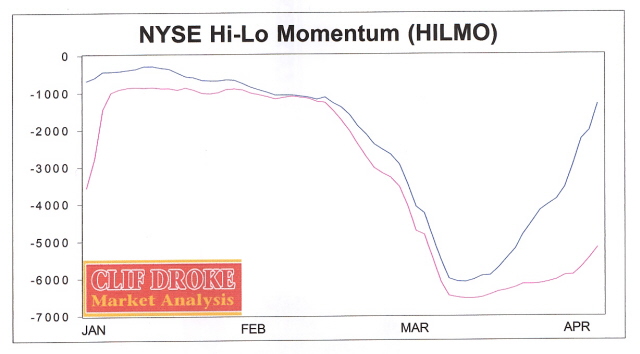
A commonly heard theme today is that the stock market is “overbought” and therefore has likely reached the terminus of its rally. As we discussed in a recent newsletter, when internal market momentum is this strong to the upside, an “overbought” market can become even more overbought, which has recently been the case. Below is what the short-term NYSE internal momentum index (HILMO) looks like. Following this important market indicator in recent weeks has certainly been profitable.
Turning our attention to the resource sector we find the price of gold has recently come under pressure. The gold price recently closed under its 60-day moving average and is now testing its dominant interim 90-day MA, a key technical benchmark for the yellow metal. This isn’t a good position for gold to be in at such a critical juncture in the marketplace and a violation of the 90-day MA would technically break the interim uptrend.
The crude oil price, by contrast, is above its all three of the moving averages in the dominant short- and intermediate-term series, the 30/60/90-day MAs. Crude oil should roughly follow the recovery in the stock market as demand from the industrial and transportation sectors gradually returns and especially heading into the summer months.
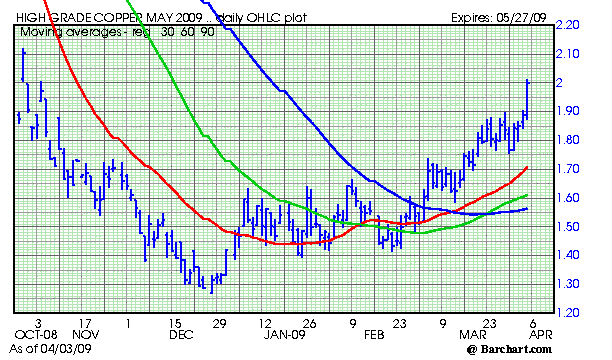
As we pointed out a few weeks ago, the turnaround in the copper price has been most impressive and has pointed the way ahead to improving economic strength. Copper is the key commodity to watch for anyone wondering whether the combined efforts of various central banks and governments at stimulating the economy will succeed. So far the copper market is saying, “Success is at hand.”
What are the thoughts of the insiders in the natural resource sector concerning the prospects for recovery? Each week I speak to top executives with various natural resource companies, often printing the interviews for the benefit of subscribers to my Junior Mining Stock Report newsletter. Here is a sampling of what some of the top minds in U.S. and Canadian-based resource companies are saying right now.
Bob Hodgkinson, CEO of Dejour Enterprises, a Canadian-U.S. oil/gas company, shared with me his insight into last year’s historic bear market and the outlook for fundamentally sound energy companies going forward: “As soon as this market begins to move a little bit you’re going to see some interesting [joint ventures] and things will get going. What we’ve seen in last 9-10 months was an aberration and not directly a result of the oil and gas business but was part of deleveraging policies put in place by the Federal Reserve chief and [former Treasury Secretary] Paulson, which caused ramifications far beyond what they thought would happen. Basically their policies caused hedge funds to bail out of commodity holdings and sent everything into a tailspin and caused the whole industry to lay down. In Western Canada, rig utilization is just 18%; in other places just 30%. But this is how industry re-invents itself and it could be spectacular when the turnaround happens.”
Chad Williams, CEO of Toronto-based Victoria Gold Corp. and a former gold analyst, share with me his thoughts on gold’s future prospects. “One of the best pieces of research I did as an analyst went back over 30 years that plotted the gold price in U.S. dollars versus Fed Funds rate. It’s the only chart you need to know for predicting the gold price. Gold does it’s best when the Fed stops easing. Inflationary expectations are at their highest. The stock market is at its lowest. We’re getting close to that point and I’m very comfortable. There’s a linear relationship with a magnitude of gold price increases and of Fed easing. There’s a positive correlation – the more they depress the spring the more it bounces back. There’s also a linear relationship with the time of easing. The longer they ease the longer it builds up inflationary expectations. How high can gold go? The answer is well over $1,000 given the amount of easing they’ve done. Not $1,500, not $2,000, but well over $1,000. I can tell you what to expect if you can tell me how low and for how long the Fed easing will last. That’s what the model predicts. It’s always different this time. It’s a very high R2. It’s just a question of plugging in the dates.”
Craig Nelsen, President and CEO of Vancouver-based Avanti Mining (molybdenum) told me: “A person who buys [resource stocks] has to believe in the [global] economic recovery. They have to have a view on steel and the development on the Third World economies and that that’s where the recovery is going to come from. They have to believe that this global economic development we’ve lived through in the past few years will continue in the future.”
Concerning the outlook for a molybdenum recovery, Nelson had this to say: “We’re not looking at much price appreciation [of molybdenum] until the third quarter of this year as the stimulus programs being put into place worldwide, including China, kick in. When these [economic stimulus initiatives] kick in I think we’ll see a bit of a whiplash in the moly market because most moly is being consumed out of stocks. Curtailing of new projects and cutbacks of existing production – it takes a while to wind that stuff back up.” He added, “. It took the big drop for this to happen – a number of traders got off side and had to put it through the processing stream. These traders knew the molybdenum price was getting soft and they had to get out of their positions at any price in November-December. That has all cleared through the trading system now and we’re in a period of de-stocking with the steel producers as their demand is down and their consuming stocks in their yards right now.”
By Clif Droke
www.clifdroke.com
Clif Droke is the editor of the daily Gold & Silver Stock Report. Published daily since 2002, the report provides forecasts and analysis of the leading gold, silver, uranium and energy stocks from a short-term technical standpoint. He is also the author of numerous books, including 'How to Read Chart Patterns for Greater Profits.' For more information visit www.clifdroke.com
Clif Droke Archive |
© 2005-2022 http://www.MarketOracle.co.uk - The Market Oracle is a FREE Daily Financial Markets Analysis & Forecasting online publication.