


U.S. Housing Market Case Shiller March 2009 Analysis
Housing-Market / US Housing Apr 05, 2009 - 11:38 AM GMTBy: Mike_Shedlock

 Inquiring minds are considering the Case Shiller Home Price Release for March 2009.
New York, March 31, 2009 – Data through January 2009, released today by Standard & Poor's for its S&P/Case-Shiller1 Home Price Indices, the leading measure of U.S. home prices, shows continued broad based declines in the prices of existing single family homes across the United States, with 13 of the 20 metro areas showing record rates of annual decline, and 14 reporting declines in excess of 10% versus January 2008.
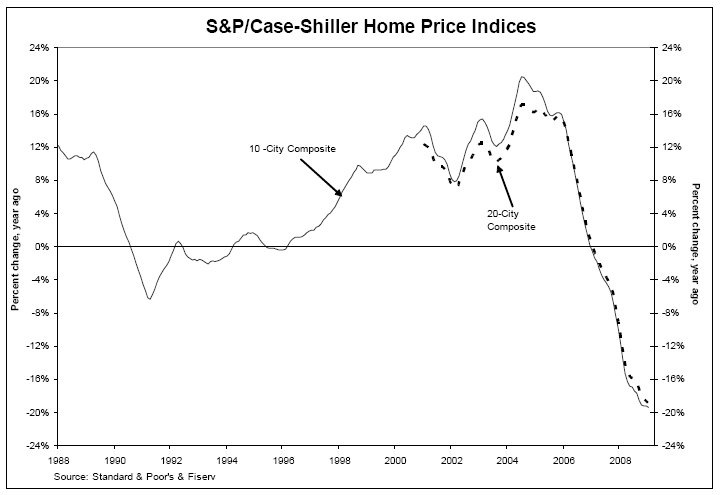
The chart above depicts the annual returns of the 10-City Composite and the 20-City Composite Home Price Indices. Following the lead of the 14 metro areas described above, the 10-City and 20-City Composites also set new records, with annual declines of 19.4% and 19.0%, respectively.
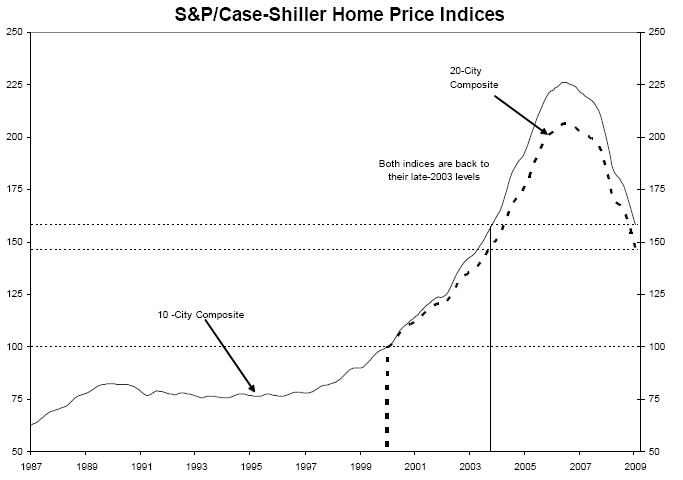
The chart above shows the index levels for the 10-City Composite and 20-City Composite Home Price Indices. As of January 2009, average home prices across the United States are at similar levels to what they were in late 2003. From the peak in the second quarter of 2006, the 10-City Composite is down 30.2% and the 20-City Composite is down 29.1%. Please see the original article for more commentary and tables on the data.
Case-Shiller Declines Since Peak
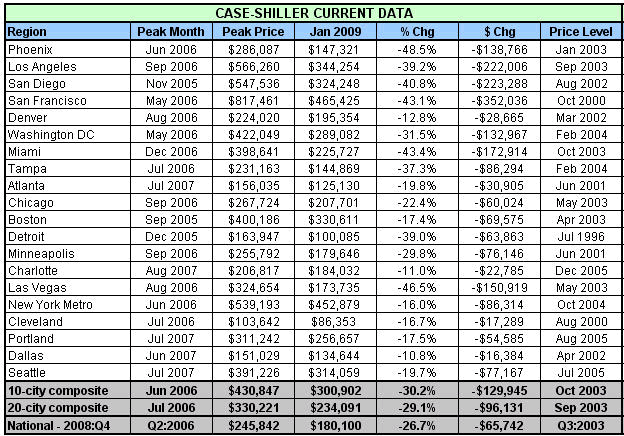
The following charts were produced by my friend "TC" who has been monitoring Case-Shiller Data. Although individual cities topped at varying times, the top-10 and top-20 city composites peaked in a June-July 2006 timeframe.
Case-Shiller Declines Since Peak Current Data
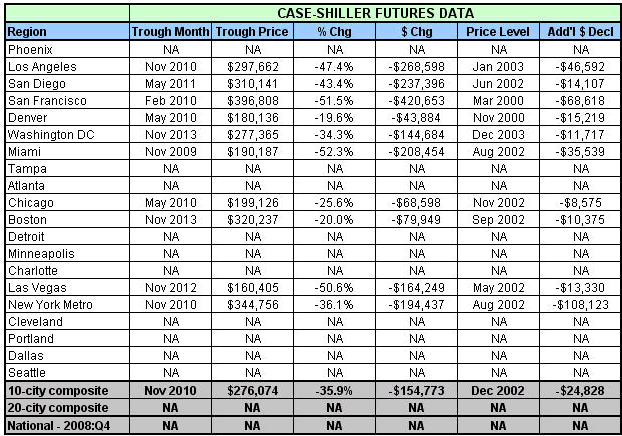
Case-Shiller Declines Since Peak Futures Data
"TC" writes:
The Jan 2009 Case-Shiller data continues to accelerate to the downside at a record pace. The 10 and 20 city index show declines from their peak at 30% and the bubble cities (along with Detroit) all have declines of 40% or more with Phoenix having the largest percentage drop of nearly 50%. Additionally, all 20 cities tracked by Case-Shiller have now experienced price declines in excess of 10%. I want to once again remind your readers that the Case-Shiller data uses a Repeated Sales Methodology (RSM) which provides the most accurate housing data available. Additionally, there are two newer columns titled "Price Level" which show both the last time prices were at the current level and what price level prices are projected to decline to based upon the CME Futures market.
When one looks more closing at the current "Price Level" data you can see that cities such as San Francisco have likely already experienced the bulk of their price decline as prices have already returned to those of 8 1/2 years ago (Oct 2000). However, cities in the Pacific Northwest (Seattle & Portland) have only seen prices return to mid-2005 levels and likely have significant price declines in their future.
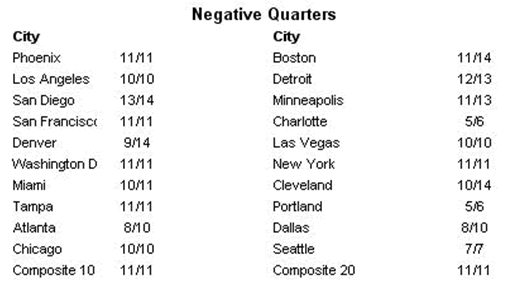
Lastly, I've added another chart titled "Negative Quarters" which shows many quarters each city has seen price declines (for example Phoenix and New York Metro have seen price declines for 11 of the last 11 quarters).
Thanks "TC"
Unemployment is soaring in 2009 and so will foreclosures, credit card writeoffs, and bankruptcies. That will add to the inventory problems.
As much as housing prices have declined, take another look at the second chart in the news release above. Imagine where prices will be if they fall back to 2001 levels or worse yet 2000 levels. Moreover, why shouldn't prices fall back that far? Finally, how many are prepared for it, if indeed that were that to happen?
By Mike "Mish" Shedlock
http://globaleconomicanalysis.blogspot.com
Click Here To Scroll Thru My Recent Post List
Mike Shedlock / Mish is a registered investment advisor representative for SitkaPacific Capital Management . Sitka Pacific is an asset management firm whose goal is strong performance and low volatility, regardless of market direction.
Visit Sitka Pacific's Account Management Page to learn more about wealth management and capital preservation strategies of Sitka Pacific.
I do weekly podcasts every Thursday on HoweStreet and a brief 7 minute segment on Saturday on CKNW AM 980 in Vancouver.
When not writing about stocks or the economy I spends a great deal of time on photography and in the garden. I have over 80 magazine and book cover credits. Some of my Wisconsin and gardening images can be seen at MichaelShedlock.com .
© 2009 Mike Shedlock, All Rights Reserved
Mike Shedlock Archive |
© 2005-2022 http://www.MarketOracle.co.uk - The Market Oracle is a FREE Daily Financial Markets Analysis & Forecasting online publication.