


US Housing Sector is Crashing, False Housing and Jobs statistics to eventually benefit Gold
Economics / US Housing May 16, 2007 - 02:14 PM GMTBy: Jim_Willie_CB

The newest deceptions are with jobs and housing. Each is much worse than reported. The housing decline might be as much as 15% worse than reported, which leads to much bigger job loss than is reported. Most of the home construction job loss is under the table, to people not on state jobless insurance programs, and to immigrant workers paid in cash. Both fall through the statistical cracks in those home frames and plywood floors underlayments. A quick preface on the two biggest corrupted statistics first, since of paramount importance.
The US Federal Reserve will likely respond to more rapid job loss, and to more rapid home sector erosion decline. When they do, expect an official rate cut sequence to resemble that of 2001. As in, sharp & sudden. The signals surround us, that the major powers are in the process of permitting the USDollar to fall.
Premeditated doctored and falsified economic statistics are the laughing stock of the USGovt reporting system. The are the tarnish on a once respected emblem. The two most important chronically corrupted pulse measures for the USEconomy are the Gross Domestic Product (GDP) on the economic growth, and the Consumer Price Index (CPI) on the price inflation. The GDP is lifted improperly by 4% to 5% in order to conceal the ongoing fight with a recession since the 2000 stock bust. The enabling device is a ridiculously low price inflation figure which might be wrong by 7% to 8%. Most reported growth is merely improperly adjusted price inflation. Be sure that the practical benefit from suppressing the CPI is to keep Social Security payments down, along with federal pensions related to agency workers, military retirees, and those who used to sit on judge benches. The direct market motive is to sell USTreasury Bonds and other debt securities, while painting a picture of fiscal health for a nation far more sickly than official statistics reveal. Lying has become an institutional feature of US government, if not corporate life.
The objective is to achieve plausible deniability of falsehood by means of abstruse goofy confusing indefensible methods behind the calculations. Like who besides math/stat jocks knows the effect of using a geometric average rather than simple arithmetic average? Doing so drops the CPI by at least 1%, a useful gimmick. Does anyone realize milk and cheese were absent from the March CPI carefully crafted calculation founded in convenient deception? If an item rises, remove it or substitute it. We all buy milk and cheese. Former USFed Chairman Arthur Burns starting the nonsense, which has taken a life of its own. He first removed volatile food & energy from the CPI, now a standard practice. The moral of the CPI/GDP story is that if you lie by at least 5% on the CPI, you not only save on the USGovt budget deficit but you enable a 5% lie on the economic growth. Who wants to report the USEconomy is stuck in a recession, now at minus 2% to 3% decline?
HOUSE SECTOR IS CRASHING
Every reason looms large that housing data is equally inaccurate as most other major economic statistics. Whether intentionally falsified or incompetently calculated by the National Assn of Realtors (NAR), it is irrelevant. Call it financial engineering. My guess is again a premeditated doctoring of the statistics, since their motive is so clear, to sell homes. In a worse declining market, sales would halt, pure and simple. We are in an age where those parties with the worst, most egregious, vested interest are given charge of assembling, calculating, and reporting their own statistics. This is laughable. Imagine the mafia in charge of reporting on crime levels, or children in school reporting on actual valid sickness and missed days in class.!
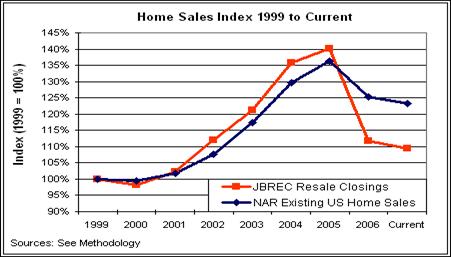
Both existing home sales and new home sales data are providing misleading national sales information. The new home curve ball involves cancellations, which are not properly recorded in current data. The housing market has declined much more sharply than is being reported, like 13% to 15% worse. When looking to confirm data, a triangular method is effective, meaning related and supporting information must be consistent. It is not. Look to other sources of information, and attempt to confirm or refute the aggregate. One inconsistency is possible, but not a set of inconsistent figures that presents itself. Independent research outfit John Burns Real Estate Consulting sampled 181 key counties with just over half of the US population where the large home builders are active. Their work is the most comprehensive and well organized to cross my desk (thanks to intrepid hound Kevin F).
Home sales have fallen 22% on a 12-month basis versus the prior 12 months, in reality. On a simple year-over-year monthly comparison, the decline is even worse. Contrast that to a mere 10% in the compromised NAR reports. It is hard to call theirs or USGovt's work analysis, when it is more like a fraudulent marketing promotional effort.
1) Mortgage Bankers Association (MBA) seasonally adjusted purchase application index is down 18% from its peak in September 2005. Not all applications are accepted, and oftentimes people fill out more than one. So how could reported sales have fallen by less than 18%, by NAR data? This not only makes no sense, but nobody seems to question it. Applications are NOT final sales, and furthermore, canceled sales make for even worse final sales figures. Go with confirmed sale closings, which is available but not utilized by the NAR. Suspect a vested interest in keeping a favorable spin!
2) DR Horton and Lennar, two largest homebuilders in the United States , have announced orders being down 27% to 37%, on an annual basis. The parent company of the group Century 21 serves as another excellent triangular data point. Their subsidiaries Coldwell Banker and ERA accounted for roughly 1.9 million brokerage related transactions in 2006 compared to 2.3 million in 2005. That comes to an annual decline of 18% nationwide. The NAR state data does cite big corrections in three major states: 28% drop in Florida , 24% drop in California , and a 28% drop in Arizona . The independent data shows the sales have probably dropped by 34%, 27% and 38%, respectively on final sale basis.
So the housing decline is much worse than reported, LIKE TWICE AS BAD. See their report (click here ). Spin versus reality might look like this, in a great chart composed by JBREC.
TWO FALLOUT FACTORS ON JOBS
Many workers in the home construction industry do not typically participate in the state unemployment insurance programs. The construction firms wish to keep their labor expenses down, and payment in cash accomplishes that objective. Paying immigrant workers in the special trades also is done on a cash basis more than is recognized by those who actually trust official data compiled by compromised bureaucrats and party apparatchiks eager to follow orders or even impress via new clever deceptions. So the official job loss data collected by the US Dept of Labor does not count those cash basis jobs. That is convenient. Financial engineering. Not only do Ripple Effect job losses occur with those involved in carpets, light fixtures, faucets, landscaping, and so on, but their lower or missing paychecks act like a contagion agent back home.
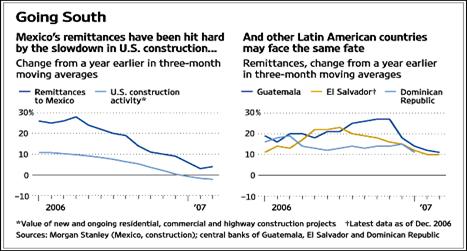
Remittances are payments made by many types of immigrant workers outside the United States to other lands, simple cash disbursements like to family members via bank wires. Agriculture and construction are the two biggest sectors with such workers. The Mexican families have seen the biggest brunt of the slide, joined by those in central American locations, alongside Dominica and some South American nations. Between 2000 and 2006, almost 20 thousand Latino workers were added in cement masonry alone, with another 72k as drywall hangers, another 140k as painters, according to the US Dept of Labor Statistics. The Mexican economy has felt the impact in pockets. Even Brazil has seen a dropoff, from $330 million in remittances in February 2007 versus a monthly average of $446 million a year ago. In previous reports, it has been noted that job cuts are under-reported among home builders. Remittances are the evidence. A tiny fraction of the workers sending less money home are inside the state system of state unemployment insurance. Not only is contagion evident in the USEconomy and US mortgage banking industry (all denied loudly), but that contagion extends to Latin America south of the border. The problems have spread to the overall economies in the entire hemisphere. The Wall Street Journal provides this excellent graphic.
THE JOBBED JOBS REPORT (AGAIN)
How does MINUS 229 THOUSAND JOBS sound for April ??? Take away the indefensible nonsensical but convenient Birth-Death model addition of 317 thousand jobs for the month, all nicely hidden and never cited, and that is what you see. Look instead to the Household Survey, and no better. You see MINUS 463 THOUSAND JOBS. Flick a switch, trigger a statistical device, and poof, just weak jobs creation during the current recession. Financial engineering.
The jobs picture confirms troublesome growth signals. The official promotional piece known as the ‘March Jobs Report' explained non-farm job growth rose by a mere 88 thousand jobs, far below the 125 to 150k required to keep pace with the population. It was the weakest report in three years. Worse still was the downward revision by 26k jobs in January and February. Revisions down are an accurate forward indicator generally, a signal of weakness ahead. Look to the trend, and downward revisions mean things are changing for the worse. The 0.4% drop in average hours worked is another confirming bad signal.
Here is the GIANT LULU. The Birth-Death Model actually added 317k jobs. ON WHAT BASIS??? From a housing decline and related fallout? Without that indefensible lift, the March jobs figure would have been MINUS 229 THOUSAND. The +95k B-D adjustment from leisure & hotels, and the +49k adjustment from construction seem way off, very contrived. The labor participation rate fell by 0.2%, which means fewer people even look for work. That kept down the jobless rate, which is a measure of state jobless insurance collection only. People are dropping out of the system. A huge 262k rise (5.8%) was seen in people NOT counted in the labor force who would like to have a job. Sounds like a jobless person to me!!!
The interesting U-6 all-inclusive statistic (unemployment + under-employment) rose to 8.2% from 8.0% in April. The Shadow Govt Statistics folks believe the jobless rate is closer to 12% in the United States . A final point is that immigrant construction workers are not included in the official statistics. Their numbers are ‘mucho mas en realidad' (much more in reality, just using my newfound Spanish skills) than what is reported. The ripple effects are now beginning to take a bite. Related niches to home building and remodeling, related niches to home lending, these are shedding jobs in droves. Refer to carpets, faucets, lighting, furniture, appliances, landscape, plumbing, wiring. Refer to loan officers, property appraisers, title search, legal, home inspectors.
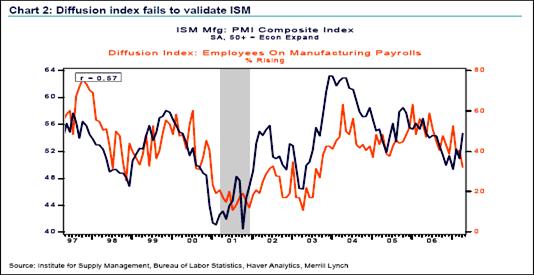
Next come contradictions. The Institute for Supply Mgmt (ISM) Manufacturing index for April was 54.7, up from the 50.7 in March. Here is where the data does not jibe. The diffusion index measures employees on mfg payrolls. It fell to 53.4% in April from 58.1% in March. The surprise positive ISM index jump to 56.0 in April from 52.4 in March SHOULD BE DISMISSED. The direction of these two series goes in opposite directions. Financial engineering. Job losses of 19k in mfg, 11k in construction, and 26k in retail testify to broad weakness. The fact remains that 3.2 million factory jobs have vanished since 2000, led by the car and downstream industries. The ISM seems doctored heavily. This chart and the contradiction were offered by Paul Kasriel of First Northern, grabbed with gratitude.
RETAIL SECTOR CONFIRMS SLOWDOWN
The investment community and public at large is told that USEconomic activity is slowing, housing remains in trouble, job growth is worse than anemic, but the jobless rate is nice & low, and manufacturing is perking up. SOUNDS LIKE RUBBISH. With a 30% decline in annual housing starts, we have seen very little in lost construction jobs in the official statistics.
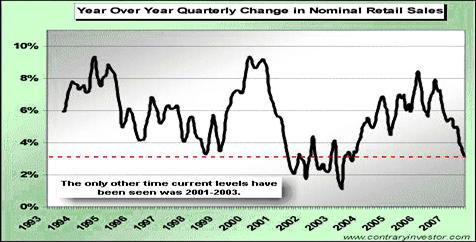
Even the retail sector is weak, at its lowest growth rate in three years, caught in a certain downtrend. Big negatives in sales were announced last week in the retail arena by chains, from Aeropostale to Abercrombie & Fitch, each more than 10% down, even Wal-Mart at minus 3.5% was the worst showing in 27 years. In the retail group, 80% missed their forecast. The April retail sales (excluding cars) was minus 0.2%, but terrible weather might have hurt those sales. We are near the low end of retail sales growth levels when a recession last hit. The following graphic is provided by the excellent data compilers and analysts at Contrary Investors.
STAGFLATION STRAIGHT JACKET
To compound the suspicions that STAGFLATION is upon us, the GDP Deflator is now running at 4.0% annually, more than double the 1.7% shown in the previous Q4. The positive news is the 2.0% growth in business investment for Q1. That rebounds from the last Q4 of 2006. The trend has been for US corporations to invest more in stock buybacks than in equipment to expand the business capital base, just like what has been quantified here among the large energy companies. Also the March factory orders showed a surprising +3.1% lift. It should be noted carefully that the bulk of the new orders for computer and business equipment were from OVERSEAS DEMAND, not US-based demand.
An aside on gasoline and fuel costs generally. They crimp consumer spending elsewhere. Sure, never under-estimate the resilience of US spenders. Well, unless gasoline becomes a problem. It is a unique cost, since IN OUR FACES EVERY DAY, on television every day, in newspapers every day, the things that Joe Sixpack & Soccer Moms pay attention to. Just yesterday, a phone call came from a friend in a coastal US city. He reports a rash of boat sales from owners who cannot afford to pay the higher fuel costs (thanks, Tim S). So higher costs have begun to force yet more liquidations of assets. How will recreational vehicle sales do? Badly, but distressed sales of currently owned RV's will shoot up. We have not yet heard from the truckers, who are a loud rough tough bunch. Gasoline, diesel, and jet fuel are the other weak links in a growing monstrously long list of weak pressure points in the USEconomy. Their prices rise with the falling USDollar, compounded by monumental irresponsibility among gasoline refiners and USGovt officials beholden to environmental causes. We keep clean surroundings but lose jobs.
The specter of stagflation puts the USFed in a horrible bind. They have been facing the double barred dilemma, to rescue the USDollar with a rate hike or to rescue the Housing sector with a rate cut. Their inaction led them directly into the nightmare of STAGFLATION, with little in the way of policy options. AS THE USFED STRUGGLES WITH ITS TOTAL ABSENCE OF POILCY OPTIONS, COST INFLATION WILL RAGE INSIDE THE USECONOMY AS THE RELEASE VALVE, WHILE THE HOUSING CRISIS WORSENS TO KILL JOBS. Now two years past the initial USFed initial interest rate hikes, the system has had ample time to send higher prices systemically throughout the economy. Plenty of resistance remains, like price ceilings imposed by China and India via outsourcing. However, the kicker is new price explosions from the gasoline side. People must get to work. Companies must receive shipped supplies. All transportation types must function along commercial arteries, from car to truck to railroad to ocean vessels to airplanes. Homes and buildings must be lit and kept cool.
Make no mistake. The USFed has four storms brewing, each powerful, each blocking a change in policy, plagued by one ancillary risk like a hemlock chaser. They are reviewed, analyzed, and developed in the May Hat Trick Letter.
- USDollar decline
- housing market distress
- mortgage cancer contagion
- teetering credit derivative structure
- trade war with China
The USFed is in an unmanageable position, sure to breed havoc upon any change, and maybe havoc without any change! To say the USFed is stuck in policy quicksand is a gross understatement. They are in a straitjacket on a platform above quicksand inhabited by mobile adaptive crocodiles!!!
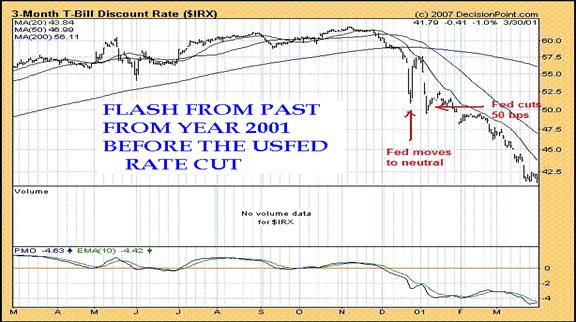
A rate cut is coming, with the USFed kicking and screaming, together with denying reality and adding indefensible credibility to utterly false economic reports. They need a smoking gun to point to, so as to shed full responsibility for their indecision and to defended credibility. The USDollar decline both confirms the expectation and leads the actual decision. The US $ decline seems an approved event. If you need that smoking gun, look no further than the decline in the 3-month Treasury Bill yield. It is analyzed in the May HTL report, along with the lack of market expectation evident in Fed Funds futures. The TBill opens the door for the USFed to cut interest rates. Bond traders have begun to push down yields in the short-term USTreasury. The USFed would then follow, more obedient to the bond market than understood. Thanks to Lance Lewis, posting on Minyanville, for the graph of the 2000-2001 timeframe comparison. We are seeing a repeat event to 2000 pattern right now.
POTPOURRI
The Hat Trick Letter issue for May is out. Among a host of other markets reported on, stories include the IBM gigantic layoff, which will be difficult to hide in the jobbed Jobs Reports. It includes the Executive Decree which authorizes intelligence czar Negroponte to permit NO DISCLOSURE by large corporations who do the USGovt bidding in market manipulation, in the name of national security. In other words, a knee-jerk assessment, is that fraud is in the US national interest. It includes the story about EuroNext, which moves us one step forward to the full integration of financial markets. It links US and European financial markets. Their control will certainly be made easier. It includes a Special Report on the Credit Market Derivatives, some information on their complex structure, and evidence of meltdown events in progress. It includes an update on the German juggernaut economic success story and the contrasting European housing bubbles in England and Spain .
Does anybody of sound mind and clear thought process now doubt my claim made in the last two years that the European Union economy is stronger than that of the United States ? They chose not to wreck their economy by pumping housing equity via debt into it. Europe does not possess a SUBPRIME MORTGAGE market, complete with associated toxic collateralized bonds. My forecast made in 2005 and 2006 was that in time, THE USECONOMY WOULD BE THE WEAKEST IN THE INDUSTRIAL WORLD. We are here, but the USFed Keystone Cops are caught in a policy nightmare. When they awaken to act, gold will zoom toward $1000 in price, along with silver toward $30. An urgent interest rate cut cycle will occur, come hell or high water with the doomed USDollar.
In fact, as analyzed in the May report, the USGovt knuckleheads might want a lower USDollar to ‘teach China a lesson' akin to shooting Uncle Same in the kneecap. Gold and silver are acting much like coiled springs. To make matters worse, the energy market is looking strong, both crude oil and natural gas. If not depletion, it is Nigerian bandits. If not Saudi Ghawar on the downslope, it is Mexican Cantarell. The US Military does its job in keeping Iraqi output low, making huge demand on supplies for military equipment. The summer driving season will draw more oil from inventories. The summer air conditioning season is here, with more drain on electricity and natural gas fuel supplies.
THE HAT TRICK LETTER PROFITS IN THE CURRENT CRISIS.
From subscribers and readers:
“I think you bring the most refreshing voice to our hard asset community that I have experienced in a long time. Your unique blend of erudition and irreverence have kept me most engaged. Your newsletter is remarkable in its scope about all things worldwide that effect our financial well-being. I think you are totally brilliant, the new Doug Casey on the scene.” (Lori B in Washington )
“As an old time subscriber, congratulations on your newsletter. It stands outside of the crowd like the Dow Theory Letter from the famous Richard Russell. Keep up your excellent work which is worth a thousand times the subscription price.” (Peter O in Austria )
“I have spent some time lately reading the special reports. Your work is brilliant, the depth of what you are doing is titanic. It is an incredibly complex and dense world that we live in. You are penetrating the fog, the lies, the misconceptions, and the poppycock. It is going to be amazing to watch it all unfold, and your commentary along the way will be the sizzle on the steak.” (Gregg F in Illinois )
“I am currently subscribed to over 60 paid newsletters. Your analysis is by far the most accurate every time. The most impressive characteristic of your thought processes is your ability to think in multi-factorial terms. You are one of the few remaining intellectuals with such capacity intact.” (Gabriel R in Mexico )
By Jim Willie CB
Editor of the “HAT TRICK LETTER”
www.GoldenJackass.com
www.GoldenJackass.com/subscribe.html
Use the above link to subscribe to the paid research reports, which include coverage of several smallcap companies positioned to rise like a cantilever during the ongoing panicky attempt to sustain an unsustainable system burdened by numerous imbalances aggravated by global village forces. An historically unprecedented mess has been created by heretical central bankers and charlatan economic advisors, whose interference has irreversibly altered and damaged the world financial system. Analysis features Gold, Crude Oil, USDollar, Treasury bonds, and inter-market dynamics with the US Economy and US Federal Reserve monetary policy. A tad of relevant geopolitics is covered as well. Articles in this series are promotional, an unabashed gesture to induce readers to subscribe.
Jim Willie CB is a statistical analyst in marketing research and retail forecasting. He holds a PhD in Statistics. His career has stretched over 24 years. He aspires to thrive in the financial editor world, unencumbered by the limitations of economic credentials. Visit his free website to find articles from topflight authors at www.GoldenJackass.com . For personal questions about subscriptions, contact him at JimWillieCB@aol.com
© 2005-2022 http://www.MarketOracle.co.uk - The Market Oracle is a FREE Daily Financial Markets Analysis & Forecasting online publication.