


Stock Market Rally Does Not Guarantee End to Bear Market
Stock-Markets / Stocks Bear Market Oct 13, 2009 - 08:43 AM GMTBy: Garry_Abeshouse

 The S&P 500 Large Cap Index (SPX) has now risen 62% and the Dow 30 Industrials (INDU) has risen 53% from their respective March 2009 lows. Bear market rallies this large are probably a constant feature of major bear markets and do not in any way indicate on their own, that a rally of this type is in the early stages of a new bull market.
For example:
Dow 30 Industrials 1929-1932: Prior to “The Great Crash” the Dow saw its peak on Sept. 3rd 1929 at 386. It fell to 195 on November 12th 1929 from where it rallied to peak again at 295 on April 4th 1930, a rise of 51% from the lows. (Note - This compares with a rise in the Dow over the last 6 months of 53%)
It then fell to eventually bottom on July 8th 1932 at 41. This was a total fall of 89% from the 1929 high and a fall of 83% from where it was on September 12th 1930. Go to this link: 1930: The Greatest Sucker's Rally In History, Play By Play for a 21 page slideshow courtesy of the New York Times.
Other major Bear Markets have experienced similar major rallies on their way to the bottom. For example:
Melbourne Metals Index 1970-1974: In Australia during the aftermath of the mining boom, after peaking in January 1970 the index fell to a low in May 1970 where it rallied 42%, falling again to rally 73% a second time in 1973, before bottoming in 1974 for a total fall of 80% from the January 1970 high.
Japanese Nikkei Index 1990-2003: After the index peaked in January 1990, it had four bear market rallies ranging from 35% to 62% before eventually bottoming in 2003.
Nasdaq 100 Index 2000 – 2002: In the wake of the Tech Bust in early 2000, the Nasdaq 100 Index rallied 43% in mid 2000, then again twice in 2001 (53% and 59%) before bottoming in 2002 for a total fall of 83% from the 2000 high.
So you can see from these examples that multiple bear market rallies of up to 73% are not uncommon and may often precede falls to new lows, with each new low no real guarantee it will be the last, until a total fall of more than 80% is reached in the main indexes.
Now is the time to also remember, that one of the distinctive characteristics of all markets, is the prevalence of bull traps prior to major moves down. Bull traps are a time when prices are propelled by high optimism to new highs and are associated with market conditions consistent with one of the main lessons from history and that is, no matter how green the economic shoots are, no matter what is intimated by economic statistics, it is always wise not to underestimate the strength of the bear, powered by the very human excesses of envy, greed and fear, or as economist Paul Krugman belatedly puts it, the “impact of dysfunctional finance” on “flaws-and-frictions economics”. In other words this is a time when green shoots can literally turn brown overnight and apparently bullish charts turn bearish before you have time to blink.
Extract from my commentary on June 23rd 2009 :
"In the USA Regional Banks (the smallest and the weakest links in the banking sector) together with anything to do with Housing and Real Estate, general Insurance and RE Insurance companies - would be some of the weakest links in the USA's financial morass.”
“I would say the pull back here in US equities, and thus ours as well, will not be a strong one - just strong enough to prolong the agony before the next leg down. I would expect the next leg down to occur some time between now and mid January, 2010, with the highest probability that it will happen before the end of October, 2009.
That would make it exactly 80 years almost to the day, after the 1929 crash.”
I obviously underestimated the strength of the rally in terms of the major indexes, but it is interesting to observe which charts did not participate in the most recent part of the rally, otherwise I still stand by the essence of what was discussed there. In Part 2 I shall show some of the charts that peaked prior to the first week of August, 2009.
Extract from my commentary on July 2nd 2009 :
“Over the last 12 months, the USD and now US equities, have formed bearish upward wedge formations on the charts. Upward wedges are usually well defined patterns showing weakening upward momentum, hence the shape. These patterns are known to be very common in stocks during bear markets and were especially so during the period 1929 to 1932.”
Despite underestimating the force of the rally, upward wedges still persist in large numbers throughout the equity market, together with still declining volumes. They are also associated with declining volume profiles. As I mentioned also in this article, the bear market experts Edwards and Magee (“Technical Analysis of Stock trends”), and I quote them again: “As a final note, we might add that the rising wedge is quite a characteristic pattern for Bear Market rallies. It is so typical in fact, that frequent appearance of Wedges at a time when, after an extensive decline, there is some question as to whether a new Bull trend is in the making, may be taken as evidence that the Primary (Bear) trend is still down.”
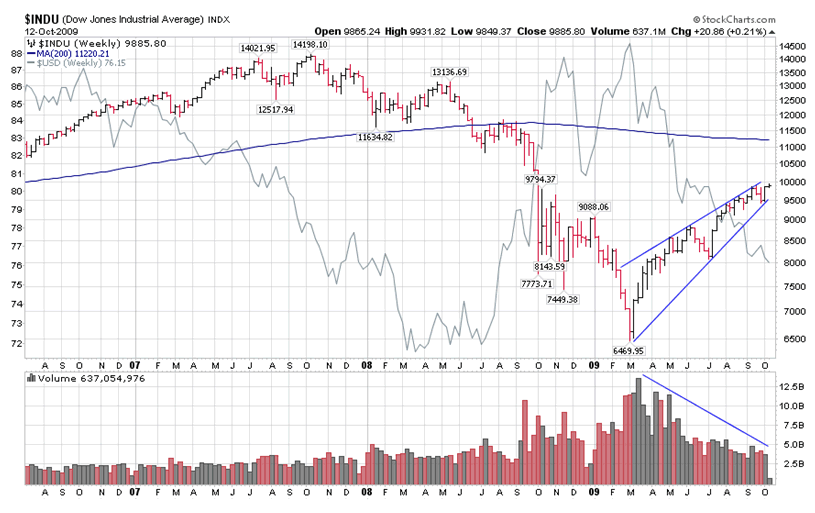
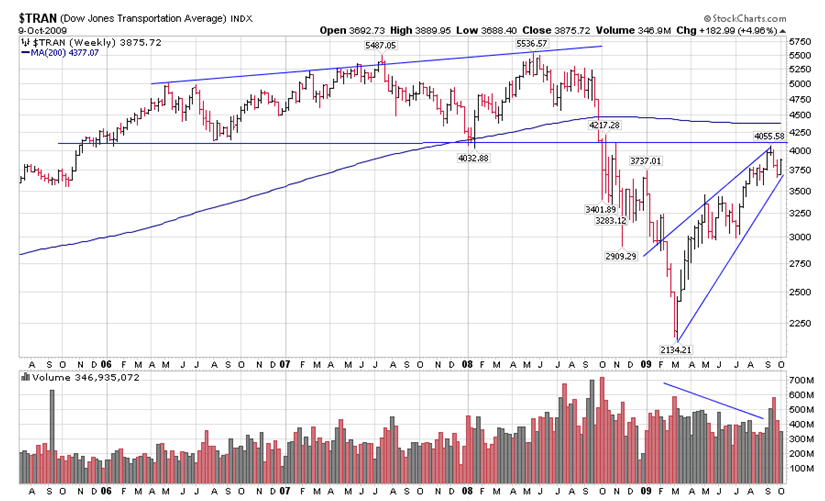
Dow 30 Industrials and Dow Jones Transportation Indexes
If Edwards and Magee were alive today, as primary exponents of the Dow Theory (and I am not one of them) the two charts below, would certainly feature at the top of their portfolio. The DJ 30 Industrials Weekly chart clearly shows both the upward wedge pattern with its associated declining volume profile and the inverse relationship between the USD and the Index.
On the DJ Transportation chart, the peak volume experienced in three of the last four weeks, while not indicative of upward wedge patterns generally, will have strong bearish connotations if or when the uptrend is broken. Both these charts illustrate both the maturity of the rally in equities and the sensitivity of the current position to a sharp move down.
Extract from my commentary on August 20th 2009 :
“The change in sentiment occurring at the moment recognises that equities are overpriced. If this is the case then conservative money will certainly go elsewhere - and for now, it looks like the USD and US T-Notes and T-Bonds are it. It may also mean that gold will initially fall along with oil and copper.
About two weeks ago I noticed the bearish talk on the USD was increasing dramatically, while at the same time the price just refused to fall. So I took a closer look at the median axis lines and pivot points, which were showing similar support stories over different time scales. Sure enough the same story kept appearing regardless of chart - daily, weekly and monthly. But the clincher was the more sensitive intraday P&F Comex charts that really began to suggest a more bullish scenario. It was all a bit of a shock really, as I have been extremely bearish on the USD dollar for a long time.
Overall the strength and size of the evolving patterns in the currency charts, suggest the possibility of an extended upward move in the USD, but there is no way I would be making uppermost projections at this stage. The highly volatile and fluid nature of currency markets at the moment, especially when there are so many unknowns about the strengths of major banks, means that upward targets need to be looked at in baby steps, one at a time. The first main resistance that must be overcome for the USD is at 81, a failure here means this whole scenario for the currencies will need to be re-evaluated. On the other side, a fall below 78 would negate the bullish scenario for the USD and change the fortune dramatically for gold.”
“The future of the gold price now hangs in the balance, as a strong move up in the USD will almost certainly cause the price to drop, even allowing for a fall in equities as well. Where it will eventually find support depends for the most part on how high the USD goes and how far and fast equities fall.”
“I expect that the oil and copper prices will move down with equity prices. This will have an adverse effect on currencies such as AUD. Note that the majority of the larger companies and EFT's associated with oil actually saw their prices peak in early June, so in effect gave an early signal of weakness in the market - as you would expect.”
“As I have discussed previously, equities appear to be in the terminal stage of an extensive bear market rally.”
Most of what I said then still applies now. Despite the USD falling below 78 and gold moving to the new high of 1068, the downward wedge for Comex USD remains intact and most recent commentaries I have read are still as bearish on the USD as ever. The bottom line here is that I would expect equities and the USD to break their trends together, as a precursor to moving in opposite directions – equities down, USD up.
Current market view
There appears to be very few bears around now, with most waiting to buy in again on any retracement, making this a good time for contrarians.
My overall scenario of topping out equities, oil, copper, currencies and rising USD and US treasuries over the coming weeks still holds.
Near term, gold could still could go either way, depending on circumstances and needs to be assessed on a day by day basis. Gold is most likely to rise strongly on the back of a falling USD. But while the USD remains within its downward wedge pattern and US treasuries hold support and are base building, it is unlikely to go very far above where it is now.
The proliferation of upward sloping wedges in the US equity market I profiled in my earlier June Commentary, have metamorphosed into more complex but similar type patterns over the last four months. They are still indicative of a bear market rally with the many weakening volume profiles highlighting the high risk environment we are in at the moment. An unusual and essenually bearish characteristic of the late stage of this rally is the high concentration of total market volume, apparently up to 50%, in only a small handful of stocks and ETFs. It should be noted, that when the uptrends of well defined upward wedge patterns are broken decisively on the downside, the resultant move down is often swift and highly destructive. What more would you expect, when a bear market rally as extensive as this one eventually dies as it must.
My view is that no one large financial market moves totally independently of the others. Finance markets are controlled by governments, large banks and hedge funds. The large banks and hedge funds are global in their financial reach, have no loyalties to anyone except themselves and their aspirations for continually higher profits.
So to watch these cowboys at work at the moment, markets such as US Treasuries, the USD, gold, oil, copper, corporate and municipal bonds are my lead indicators ahead of the equity markets and will show the way, when they are all ready to move as one. It is getting close, but full confirmation of the next major move in financial markets has not yet occurred. But we have a beginning with an early lift-off in US Treasury prices and a commensurate drop in yields.
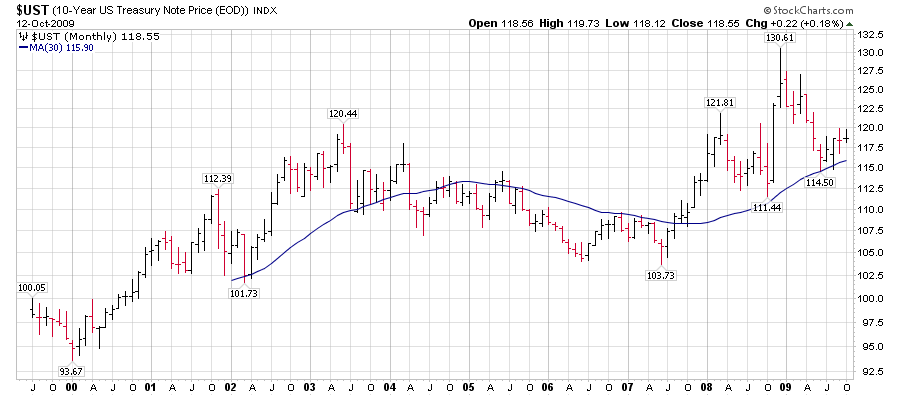
December 10yr T-Notes, intraday Comex chart at 119.9, has broken decisively through all peaks going back to about April 23rd 2009 on and adjusted basis.
(I adjust all my Comex charts when they change months). 119.9 also coincides with the top of a broad trend channel, so having a downward reaction from there would be not unexpected. This move up in fact confirms a large base going back to about May 21st 2009, containing a mid-fulcrum rally around July 10th. Until proven otherwise, the base formation on this chart is as good as it gets and indicates the probability of much higher prices to come.
For future reference the high reached 126.1on March 18th 2009 (unadjusted) or 122.6 (adjusted). Current uptrend hits at 118. I have chosen a monthly chart for the 10yr T-Notes to illustrate exactly where we are historically. Support and resistance will be in slight variance to Comex prices.
December USD Index, Comex intraday chart shows a large downward sloping wedge originating back on March 11th 2009, which by no coincidence is exactly the same time the equity rally started. Ironical isn’t it, that the equity market is flooded with upward wedges, the classic sign of a bear market rally, yet we have the exact opposite for the USD over exactly the same time frame. The downward wedge’s main downtrend is still intact. A break above the recent 77.7 high would also break this trend as well. But to really confirm this wedge I would like to see initially at least, a sharp move through 80 before a reaction sets in. After that we shall have to take this roller coaster as it comes – but, this pattern in the USD is very large and has the potential to test the March high.
On my Comex charts this would be 90.1 (unadjusted) and 90.6 (adjusted). At this stage though I am not prepared to give any sort of target above 82.
On the bearish side, a sharp move below 75.5 would negate the above bullish scenario and the whole situation would have to be reassessed. A downward move such as this in the near term, would probably be preceded by a sudden highly charged news event of some sort, which I might add could happen at any time, given the precarious nature of the world’s financial system.
A brief word on the Japanese yen and the Euro. Due to the potential strength of the USD, if the downward wedge is confirmed as above, this will probably be a confusing time for the yen. If all that the USD does is rise to about 80 and that’s as far as it goes, then there is a good chance that the longer term bullish patterns in the Yen and the Euro I have mentioned in previous Market Commentaries could still apply. Obviously the higher the USD goes, the more the negative effect this rise will have on other currencies, including the Yen, Euro, Pound and the AUD. This will be a testing time in which support and resistance levels, together with historical trendlines will all play their important roles.
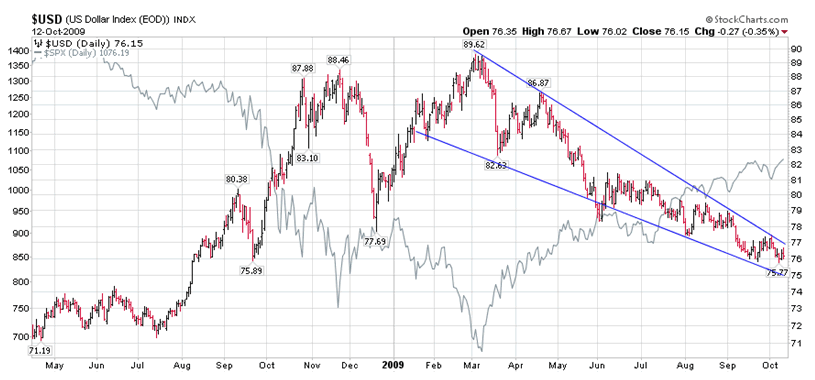
While the USD remains weak in the short term, other markets will probably show repeated attempts to test their local highs and some may even make new highs, but I do believe at this stage that any such moves will be short lived. The above chart also shows the close inverse correlation to equities.
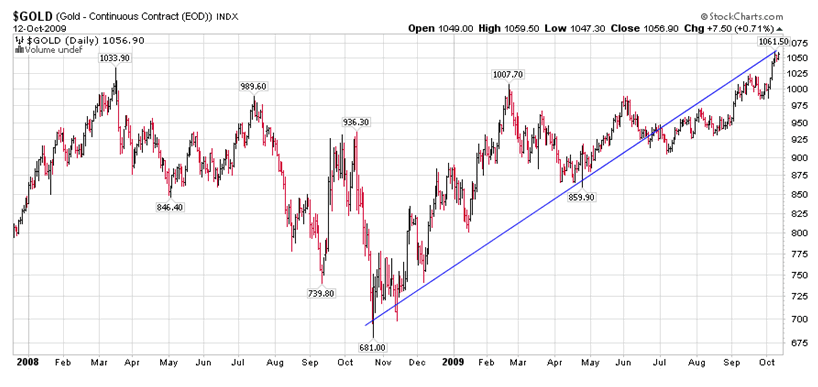
December Gold, Comex Intraday. On my less sensitive charts gold has been trading in a very well defined upward sloping wedge pattern since November last year (not really visible on the daily bar chart below). As discussed earlier, this pattern generally has bearish tendencies attached to it. The uptrends on both my charts are as well defined as I have ever seen, with multiple testing points along the entire uptrends. Any successful testing of the 900 lows would confirm a solid break of these uptrends, which would negate any future bullishness for the time being and mean that any return to this condition would be have to be worked out in the market over time.
You can see the gold price below on the Daily bar chart, crawling up underneath the uptrend. As long as the price remains underneath this trend I consider this action bearish and just moving above this trend by a small margin will not contradict this view.
Even a successful testing of the recent highs by a small margin would not necessarily negate the bearish scenario. Also beware of gold stocks leading gold on the upside. As in the 1970’s, I would be wary when the stocks lead the gold price into the sky. If and when gold does resume its bull trend, there will be a high probability it will happen with little warning, it will just go.
When gold peaked at 1062, it bounced off a well defined resistance line on my more sensitive 2pt chart and at the time of writing is churning within a very narrow range above 1038. Any fall below this point would probably see a retracement to test the support between 9901 and 1000.
As I write these words gold has risen to 1068, but it is still below the resistance line and needs a decent rise of over 100 pts or more from here to confirm a true breakout. The accompanying strength of the USD and US Treasury prices at this time and confused moves in equities, suggests that this move in gold will not go very far.
Without a substantial fall in the USD it will be difficult for gold to reach the escape velocity required for the run up that the gold bugs have been waiting so long for. They will just have to be patient and make sure they have close stop losses on their contracts.
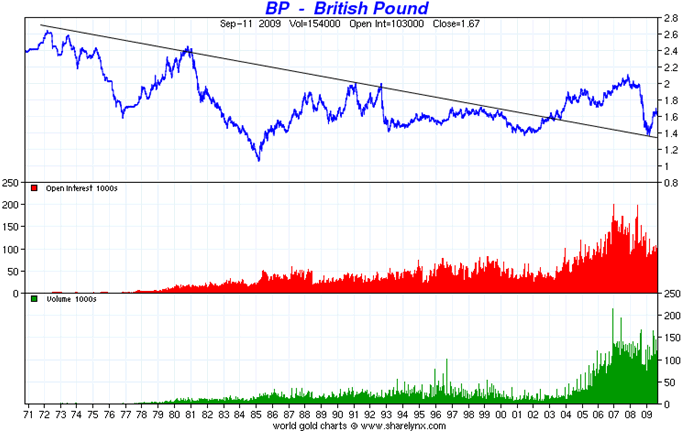
The British Pound Sterling A Major Disaster Just Waiting to Happen?
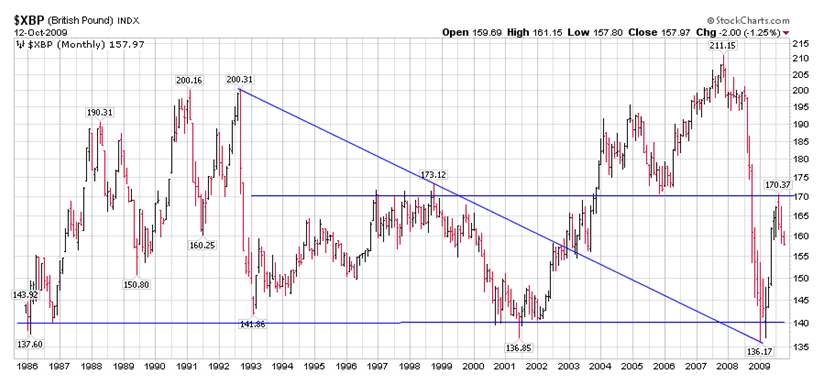
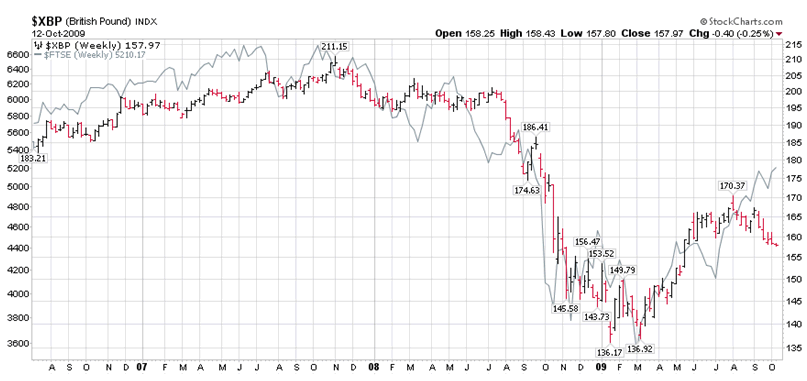
I have kept any comments on Sterling until the end of my commentary, because it may be an important key to events that will be played out over the coming weeks and months. Firstly, the long term chart (courtesy of www.sharelynx.com) shows the price going back to 1971. Important to notice here is the 1982 – 1985 fall from 2.4 to near parity, just above 1.0. Since then Sterling has always found support at 1.4, the most recent one being at the end of 2008 when the price bounced off the long term downtrend. The support at 1.4 and historical resistance at 1.7 can be seen more clearly on the Stockcharts.com Monthly chart below, while the weekly chart shows the close direct correlation between the equity market and the currency – unlike the USD, which shows a reverse correlation.
This shows clearly that any significant move down in equities could quite feasibly see Sterling test the March 2009 lows. A break below 1.4 would be historically highly significant as it would relate this fall directly to the currency crisis of the 1980’s. It is interesting to speculate whether this potential move down in Sterling will be a cause or effect move – either way the results will be the same – and that is a rise in the USD. Given the current poor fundamentals surrounding Sterling, how far Sterling falls over the coming weeks and months will also directly relate to how far the USD rises over this time.
Till next time.
Garry Abeshouse
Technical Analyst.
Sydney
Australia
I have been practicing Technical Analysis since 1969, learning the hard way during the Australian Mining Boom. I was Head Chartist with Bain & Co, (now Deutsch Bank)in the mid 1970's and am now working freelance. I am currently writing a series of articles for the international "Your Trading Edge" magazine entitled "Market Cycles and Technical Analysis".
I have always specialised in medium to long term market strategies and after discovering the excellent Point & Figure Charts from Stockcharts.com in mid 2008, have concentrated on this style of charting ever since.
© 2005-2022 http://www.MarketOracle.co.uk - The Market Oracle is a FREE Daily Financial Markets Analysis & Forecasting online publication.