


Weekly Stock Market Technical Report
Stock-Markets / Forecasts & Technical Analysis Dec 16, 2006 - 04:02 PM GMTBy: Mike_Burk

The good news is the Dow Jones Industrial Average closed at another all time high last week while the Wilshire 5000 and S&P 500 (SPX) hit a multi year highs.
Short Term
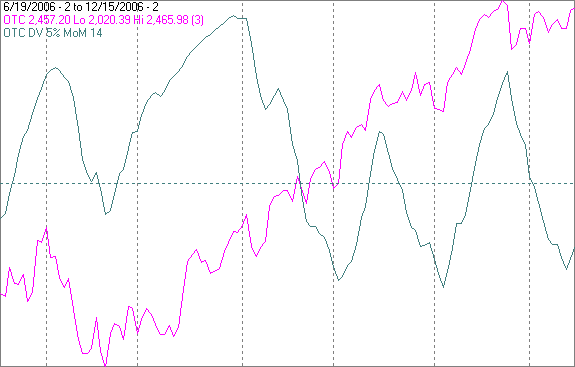
Momentum of downside volume is an indicator that works pretty well from time to time. The chart below is an update from last week covering the past 6 months showing the NASDAQ composite (OTC) in magenta and momentum of NASDAQ downside volume in green. Dashed vertical grey lines have been drawn on the 1st trading day of each month. The indicator has been plotted on an inverted Y axis so increasing downside volume pushes the indicator downward (up is good).
Since this rally began prices have moved up sharply when the indicator was moving upward and have continued to move upward, but not as quickly when the indicator was moving downward.
Last week the indicator turned upward suggesting this years Santa Clause rally could be a good one.
Intermediate term
The rally off of last summer's lows has been unusual in its persistence.
The chart below shows the SPX in red and momentum of an advance - decline line constructed from new highs and new lows in magenta. New highs and new lows have been calculated on the component issues of the SPX over the trailing 6 weeks rather than 52 weeks as reported by the exchanges.
The indicator began rising last summer and was stuck at the top of the chart for about 3 months until it dropped sharply in late November. It turned back upward last week.
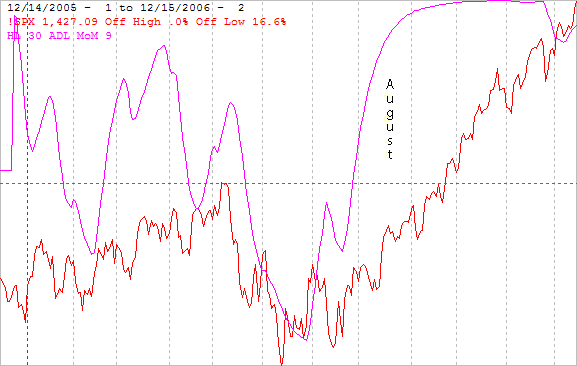
The only other period, in the last 10 years when the indicator remained near the top of the chart for a prolonged period was in late 1996.
The chart below is similar to the one above except it covers the year from March 1996 to March 1997. There are a number of similarities. A rally began in the summer of 1996 and the indicator remained near the top of the chart for about 3 months. The indicator made a sharp decline in mid December then moved upward along with the index for the next 2 months until late February.
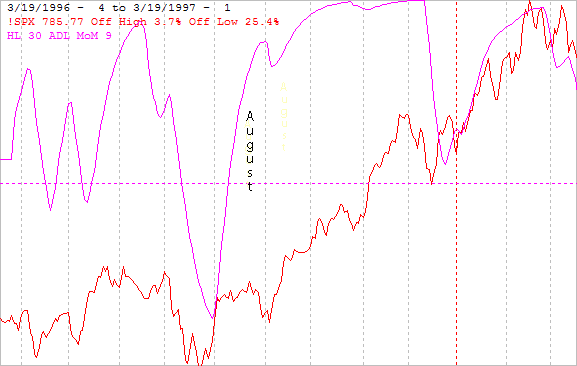
The recent decline in this indicator was not as severe as the decline in 1996. If the pattern holds, there should be quite a bit of life left in the old bull.
Seasonality
Next week includes the 5 trading days before Christmas during the 2nd year of the Presidential Cycle. The tables below show the daily performance of the OTC and SPX over that period.
OTC data covers the period from 1966 - 2002 and SPX data from 1954 - 2002 during the 2nd year of the Presidential Cycle. There are summaries for both the 2nd year of the Presidential Cycle and all years combined beginning with 1963 for the OTC and 1953 for the SPX. The OTC has been up about 50% of the time with a very positive bias. The SPX has been up nearly 70% of the time. The last half of the week has been stronger than the first half.
Report for the 5 days before Christmas.
The number following the year represents its position in the presidential cycle.
The number following the daily return represents the day of the week;
1 = Monday, 2 = Tuesday etc.
| OTC Presidential Year 2 | ||||||
| Day5 | Day4 | Day3 | Day2 | Day1 | Totals | |
| 1966-2 | 0.18% 1 | -0.38% 2 | 0.47% 3 | 0.84% 4 | 0.34% 5 | 1.46% |
| 1970-2 | 0.28% 5 | -0.44% 1 | 0.12% 2 | -0.17% 3 | 0.13% 4 | -0.08% |
| 1974-2 | 0.74% 3 | -0.29% 4 | -1.33% 5 | -1.38% 1 | 0.76% 2 | -1.49% |
| 1978-2 | -2.62% 1 | 0.35% 2 | 0.52% 3 | 0.45% 4 | 0.93% 5 | -0.37% |
| 1982-2 | 1.48% 5 | -0.46% 1 | 0.28% 2 | 1.10% 3 | 0.56% 4 | 2.96% |
| Avg | 0.01% | -0.24% | 0.01% | 0.17% | 0.54% | 0.50% |
| 1986-2 | -0.26% 4 | 0.24% 5 | -0.27% 1 | -0.72% 2 | 0.25% 3 | -0.76% |
| 1990-2 | 1.22% 2 | 0.28% 3 | 0.29% 4 | 0.35% 5 | -0.32% 1 | 1.82% |
| 1994-2 | -0.16% 1 | 0.09% 2 | 1.22% 3 | 0.26% 4 | 0.39% 5 | 1.79% |
| 1998-2 | 2.06% 5 | 2.49% 1 | -0.80% 2 | 2.43% 3 | -0.44% 4 | 5.75% |
| 2002-2 | -2.19% 3 | -0.54% 4 | 0.66% 5 | 1.37% 1 | -0.67% 2 | -1.38% |
| Avg | 0.13% | 0.51% | 0.22% | 0.74% | -0.16% | 1.45% |
| OTC summary for Presidential Year 2 1966 - 2002 | ||||||
| Averages | 0.07% | 0.13% | 0.12% | 0.45% | 0.19% | 0.97% |
| %Winners | 60% | 50% | 70% | 70% | 70% | 50% |
| MDD 12/23/1974 2.97% -- 12/19/2002 2.73% -- 12/18/1978 2.62% | ||||||
| OTC summary for all years 1963 - 2005 | ||||||
| Averages | 0.10% | -0.02% | -0.10% | 0.26% | 0.33% | 0.57% |
| % Winners | 56% | 45% | 56% | 67% | 65% | 58% |
| SPX Presidential Year 2 | ||||||
| Day5 | Day4 | Day3 | Day2 | Day1 | Totals | |
| 1954-2 | 0.26% 5 | 0.89% 1 | 0.14% 2 | -0.11% 3 | 0.08% 4 | 1.26% |
| 1958-2 | 0.43% 4 | -0.15% 5 | -0.67% 1 | -0.54% 2 | 1.29% 3 | 0.36% |
| 1962-2 | -0.48% 2 | 0.82% 3 | 0.38% 4 | -0.29% 5 | -0.02% 1 | 0.42% |
| 1966-2 | -0.38% 1 | -0.38% 2 | 0.52% 3 | 0.38% 4 | -0.27% 5 | -0.13% |
| 1970-2 | 0.20% 5 | -0.31% 1 | 0.11% 2 | 0.07% 3 | 0.57% 4 | 0.63% |
| 1974-2 | 0.47% 3 | -0.37% 4 | -1.09% 5 | -1.42% 1 | 1.39% 2 | -1.01% |
| 1978-2 | -1.98% 1 | 0.86% 2 | 0.47% 3 | 0.03% 4 | 1.69% 5 | 1.06% |
| 1982-2 | 1.62% 5 | -0.89% 1 | 1.72% 2 | 0.16% 3 | 0.64% 4 | 3.25% |
| Avg | -0.01% | -0.22% | 0.35% | -0.16% | 0.80% | 0.76% |
| 1986-2 | -0.32% 4 | 1.20% 5 | -0.39% 1 | -0.97% 2 | 0.17% 3 | -0.31% |
| 1990-2 | 1.24% 2 | 0.05% 3 | -0.02% 4 | 0.49% 5 | -0.56% 1 | 1.19% |
| 1994-2 | -0.19% 1 | -0.18% 2 | 0.55% 3 | 0.02% 4 | 0.03% 5 | 0.23% |
| 1998-2 | 0.68% 5 | 1.25% 1 | 0.07% 2 | 2.07% 3 | -0.18% 4 | 3.88% |
| 2002-2 | -1.31% 3 | -0.77% 4 | 1.30% 5 | 0.18% 1 | -0.55% 2 | -1.15% |
| Avg | 0.02% | 0.31% | 0.30% | 0.36% | -0.22% | 0.77% |
| SPX summary for Presidential Year 2 1954 - 2002 | ||||||
| Averages | 0.02% | 0.15% | 0.24% | 0.01% | 0.33% | 0.74% |
| %Winners | 54% | 46% | 69% | 62% | 62% | 69% |
| MDD 12/23/1974 2.86% -- 12/19/2002 2.08% -- 12/18/1978 1.98% | ||||||
| SPX summary for all years 1952 - 2005 | ||||||
| Averages | 0.16% | 0.01% | 0.09% | -0.04% | 0.27% | 0.48% |
| % Winners | 52% | 40% | 56% | 47% | 70% | 69% |
Santa Clause is scheduled to arrive Wednesday.
Conclusion
Several short term indicators bottomed last week just in time for the year end rally that should begin next week. I expect the major indices to be higher on Friday December 22 than they were on Friday December 15.
By Mike Burk
To subscribe to this report : http://alphaim.net/signup.html
© 2005-2022 http://www.MarketOracle.co.uk - The Market Oracle is a FREE Daily Financial Markets Analysis & Forecasting online publication.