


Stock Market Plunge Wipes Out December and January Gains!
Stock-Markets / Stock Markets 2010 Jan 24, 2010 - 11:20 AM GMTBy: Piazzi

 S&P shed 44 points last week, and established a mid-term downtrend.
This is what I wrote regarding the weekly frame in Thursday’s post
There are signs of a correction on the chart, broken uptrend line, rapidly falling RSI, a cross on MACD
And
13 EMA is at 1103 which coincides with our 1107 pivot, and should be a first level of support.
And
It’s a market that needs urgent bull action to prevent serious technical damage.
This is a current weekly chart
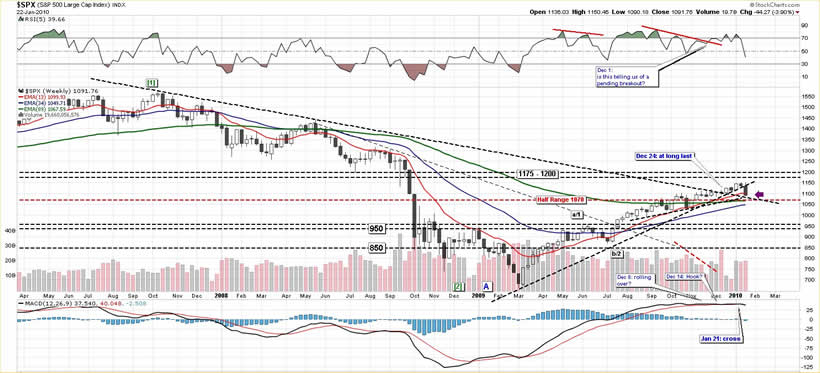
1107 pivot afforded a brief pause but could not hold the rush down. And index closed below its 13 EMA for the first time in months.
Index is now very close to the 2007 downtrend line, which it took in December 2009, and about 30 points above the half-range marker (1070) that I had set in August. We also have 89 EMA at 1067 at this moment.
So, if index wants to reverse, or at least pause (bounce?) before another leg down, it should find support somewhere between here (1091 pivot) and our next pivot 1061. A break of 1061-1091 pivot band may cause very serious technical damage and create a lot of overhead supply. So, this week is very important for the index and if bulls are still in control of the market, they should try to stabilize the index and bounce from somewhere in the 1061-1091 pivot range.
For the day, volume was huge. Breadth was bad.
Thursday broke the trend line and 21 EMA that was the support since December. Friday sliced through 55 EMA, and we now have a mid-term downtrend on the index.
We had been pointing out distribution days based on volume pattern, and saying that they were a bit frequent. Thursday and Friday were no exception and downward pressure increased. The question now is whether we have enough of a washout for at least a temporary pause and perhaps a bounce.
McClellan Oscillator is another tool that I use often. I pointed out its plunge into negative territory on Thursday. Friday brought the oscillator down into oversold areas.
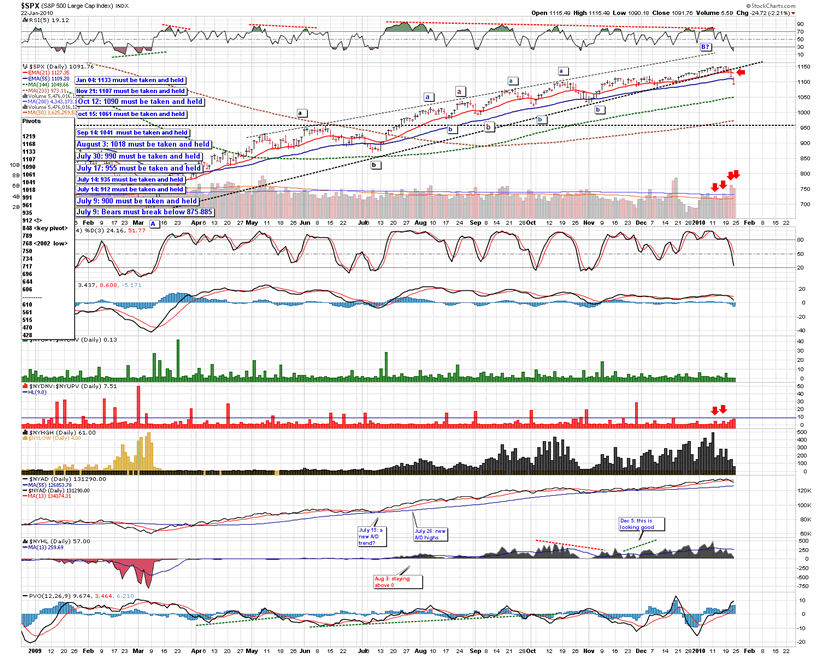
This another breadth chart that I frequently present
Referring to the same chart on Thursday, I said that we had breadth sell signals, and that
market is oversold, a good uptrend should bounce from oversold. It is now up to the bulls to show if they are still interested in keeping their rally alive. It should not be difficult for them to jump start a rally as there must be a lot of shorts in the system.
The failure of the index to hold 1107 pivot and bounce from there was a strong indication that the uptrend may not have been very healthy, and the day gave us a confirmed change in OEW mid-term trend.
This what I wrote on January 4
while many and many bloggers and pundits are busy making predictions as to what markets should do, I lay out the picture in front of me and wait for it to tell me what I should do.
So, once again, we followed the charts, we examined probable outcomes, and we did OK – quite well, actually, but let’s not lose our modesty and humility as market is the master and we the followers
OK, we did well, but where do we stand now?
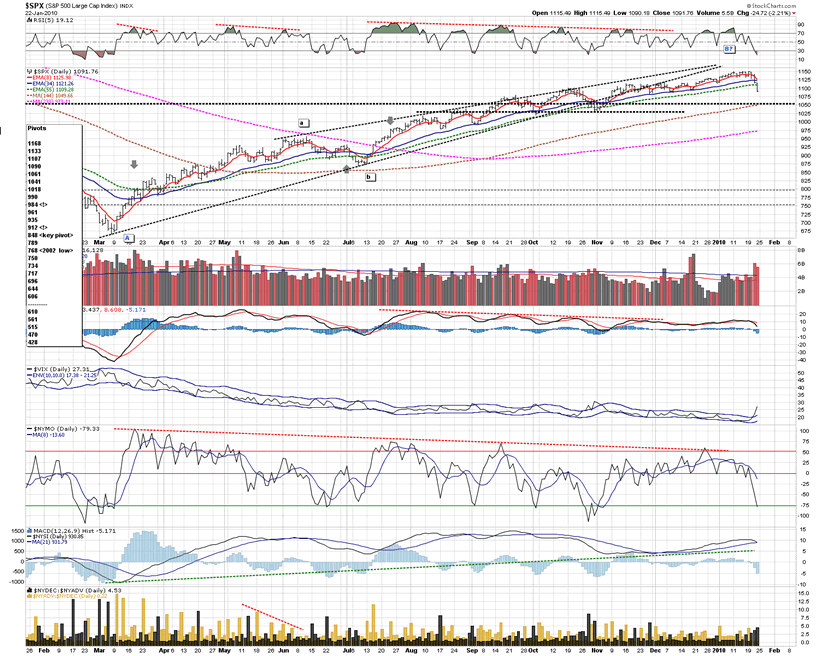
This is a daily count
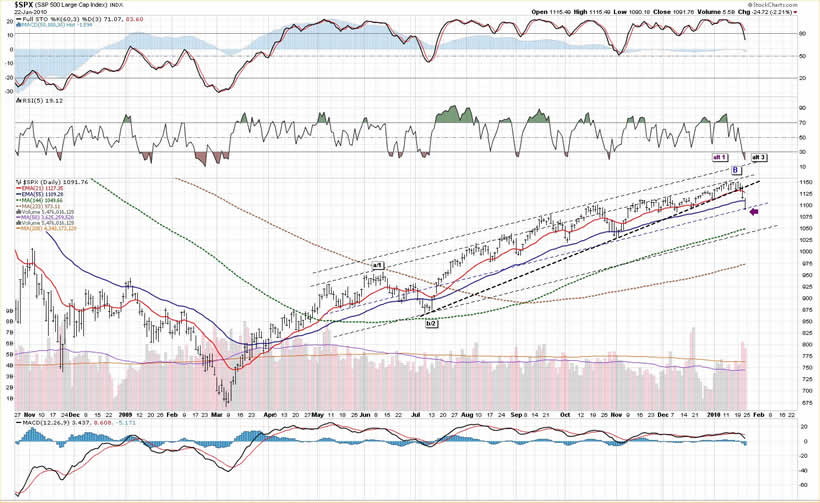
Well, now comes the moment of truth for bulls as far as wave structure is concerned.
Notice that I have added two alternate bullish counts to the chart.
Long-time readers may remember that, on occasions, I have presented a bullish count with impulsive waves since March.
In order to have a multi-month, multi-year bull market, priced structure should ideally unfold in an impulsive manner with 5-wave advances
We so far have had three waves up from March low. We have been labeling it as a Primary B = Major A-Major B-Major C. But have been keeping a bullish alternate as well.
Now, if we have a bull market, I would like to see an end to this correction somewhere around or before 950, and then another 5-wave advance that would make a new high north of 1150.
That might take weeks or months. But it is something to require from the bulls as it seems like it is becoming their turn to prove themselves.
Meanwhile, I follow the price and try to see where it takes me and what opportunities it may give me.
This is a 60-min chart
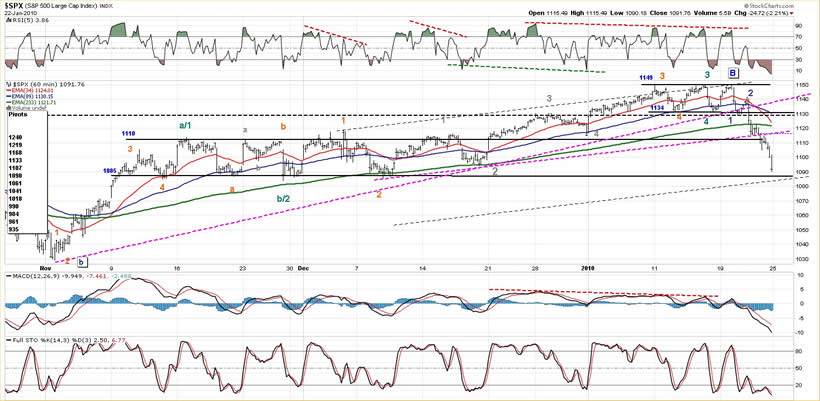
First off notice the two pinkish trend line that I said I thought were important. They acted as excellent guides on the wave down, each holding price momentarily and then signaling more downward action as they broke.
We are back to the bottom of the 1085-1110 range that we played on the long side. All of the gains of the December-January players who stayed in two days too long are now wiped out.
We have a brand new extreme low in short term momentum. Waves down so far have been clean. We seem to be is a wave 3 of some degree. If index is going to stabilize and bounce, given the severity of the downward kickoff, I would think that the first attempt might be fake (for a wave 4) and then another push down (for a wave 5) and some positive divergence on momentum.
That is what I am looking for based on past observations. Market may deliver a different thing altogether. So, let’s just pay attention to what market tells us and act accordingly.
We are at 1090 pivot, and the next one down is 1061.
On Thursday, I continued on my daily momentum cycles of S&P and said
there has been two 3-cycle phases, one from March to June, and one from July to November. Each phase had its first cycle registering the highest peak and the following two cycles registering decreasing peaks.
And
the phase that started after November’s mini correction/range consolidation has had two cycles. If S&P repeats it cyclical momentum pattern, we will get another up cycle for momentum, and another upswing of price – maybe after this dip turns for a bounce. There is no guarantee that it happens, but I think it is something worth watching as I monitor the short term count alternatives
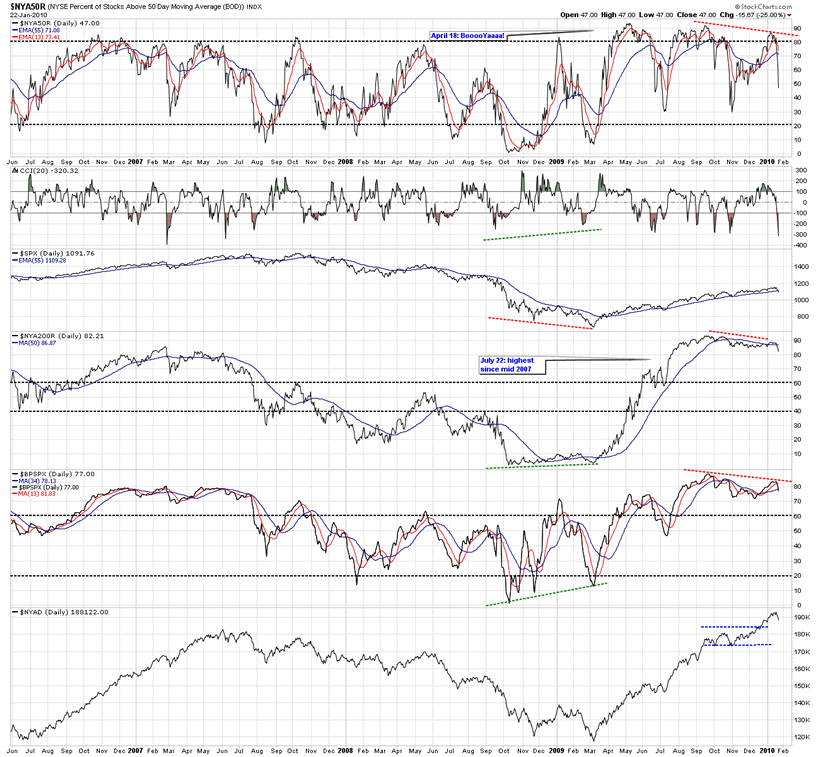
This is a current chart
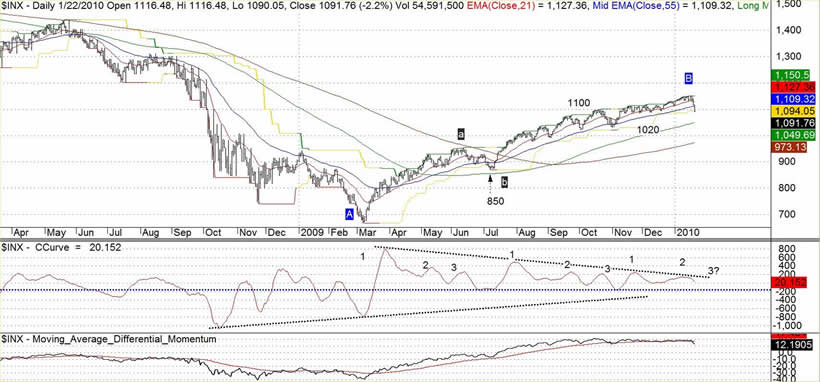
Despite the scary drop, all the bear jubilation, and all the talk of this being a straight drop into depths of hell that only uber-bears can foresee and foretell, the daily cyclical momentum has not yet undercut its previous low. As such, my scenario of another possible daily momentum cycle peak is still alive.
So, given what we have discussed above, if the oversold price and breadth condition help market to stabilize around here, or a bit lower, we may have a three-cycle structure for daily momentum. If that comes to pass, a failure to exceed the previous peak shall, IMO, constitute a third magnitude momentum failure for the entire move from March and would provide a structurally favorable condition for a short to position to nurse for days with the stop being a new high for now, and to be adjusted later.
None of this is exact science and hence all the if and may and might and so on
I emphasize, the above scenario is purely theoretical and is something I am keeping in the back of my mind for a possible longer term hold on a bet against the market. What is more important is price does with respect to levels and pivots that I deem significant.
To Wrap Up:
S&P is in a confirmed mid-term downtrend.
Barring a new high, I am operating under the assumption that we have a top. The challenge is for the bulls to prove their worth and negate that scenario. It’s just an assumption and not a close-mindedness. If the situation turns, I shall turn as well.
Index is oversold. In downtrends, oversold can beget more oversold. These past two days were not kind to the buy-the-dip crowd. Be careful!
Support is right here at 1090 and then at 1061. Resistance is 1107 and 1133.
Long term trend is up. Intermediate trend is down. Short term trend is down
By Piazzi
http://markettime.blogspot.com/
I am a self taught market participant with more than 12 years of managing my own money. My main approach is to study macro level conditions affecting the markets, and then use technical analysis to either find opportunities or stay out of trouble. Staying out of trouble (a.k.a Loss) is more important to me than making profits. In addition to my self studies of the markets, I have studied Objective Elliott Wave (OEW) under tutorship of Tony Caldaro.
© 2010 Copyright Piazzi - All Rights Reserved Disclaimer: The above is a matter of opinion provided for general information purposes only and is not intended as investment advice. Information and analysis above are derived from sources and utilising methods believed to be reliable, but we cannot accept responsibility for any losses you may incur as a result of this analysis. Individuals should consult with their personal financial advisors.
© 2005-2022 http://www.MarketOracle.co.uk - The Market Oracle is a FREE Daily Financial Markets Analysis & Forecasting online publication.