Gold, Stay Away Until the Dust Settles
Commodities / Gold and Silver 2010 Feb 07, 2010 - 11:27 AM GMTBy: Merv_Burak
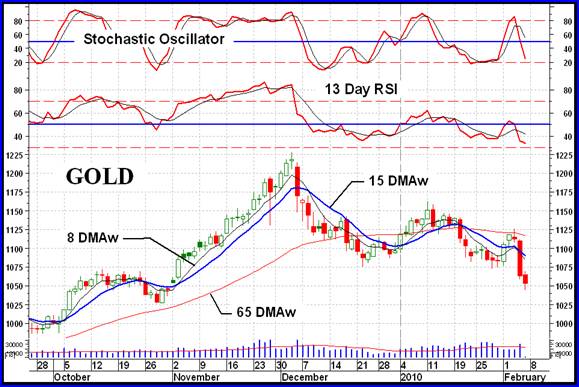
 Gold looks great if you turn the page upside down. Otherwise, one might just stay away for a while until the dust settles. The NYMEX close for gold was $1052.80 while only an hour or two later the Globex electronic trading showed gold at $1065. One might just wonder what goes on here.
GOLD LONG TERM
Whether gold closed at $1052.80 or $1065 does not change the long term picture. It traded below the $1065 level and therefore triggered a bear signal from the long term perspective. As mentioned last week, this is not a MAJOR event (from the P&F perspective) as the down side projection is only to the $975 level. I have long learned that unless the P&F projection is for a major move (relative to the P&F parameters used) the move may not even get to the projected level so it will be interesting where this takes us before a reversal of trend is signaled.
Looking at the usual indicators the NYMEX close was below the long term moving average line while the Globex price at around 4:00 P.M. was above the moving average line. In either case the moving average remained in an upward trend. The long term momentum indicator is moving lower fast and is below its negative trigger line but is still slightly above its neutral line in the positive zone. The volume indicator, although moving lower, has held up pretty well. It is still above its lows from the previous Dec action but has dropped below its trigger line. The trigger has not yet reversed and is still pointing upward. The long term indicators are weakening but have not yet turned fully bearish. The rating for now can be classified as – NEUTRAL, one level above a full bear rating.
INTERMEDIATE TERM
The week started promising with the price of gold just about reaching the intermediate term moving average line before the price turned around and continued its downward spiral. It ended the week below a negative sloping moving average line. The momentum indicator was just a tinge below its neutral line the previous Friday but quickly rebounded higher as the price turned upward at the beginning of the week. Unfortunately, everything went south on Wed and the momentum indicator is once more in its negative zone below a negative trigger line. As for the volume indicator, it dropped below its trigger line the previous week and remained below throughout this past week. The trigger line has turned to the down side as a result. The intermediate term rating remains BEARISH.
SHORT TERM
This is where the difference in the two closing prices (NYMEX and Globex electronic trading) makes a difference. Without the knowledge of the Globex close everything on the short term would be looking very bearish. With the knowledge of the Globex close we can see an end of day turn around in the immediate trend of the price.

Despite what the Globex trading suggests for the immediate trend nothing much has changed from the short term perspective. The gold price remains below its short term negative sloping moving average line regardless of which close we use. The momentum indicator remains in its negative zone below its negative trigger line. The daily volume action seems to be perking up as the price drops. Not usually a good sign. From the indicators, at this particular time, the short term rating must remain BEARISH.
For the immediate direction of least resistance, using the Globex price, we would have had a candlestick bar on Friday that would have indicated a one day turn around action. However, the trading rage was not that large compared to earlier trading ranges so the turn around may be short lived. This is only important for the day trader. The short or intermediate term gambler or speculator would wait for some better confirmation of a turn around of trend before risking capital.
It may be interesting to note that one of my confirmation indicators for a reversal of trend is for the next shorter term moving average line to cross the trend moving average line in the direction of the trend. This has not happened for either the intermediate or short term trends.
SILVER
Silver is going through a similar negative trend as gold is going through except the trend in silver is a little more pronounced. This week, gold lost 2.8% of its price while silver lost 8.4%. Where silver had been out performing gold for some time in very recent weeks it has been the other way around.

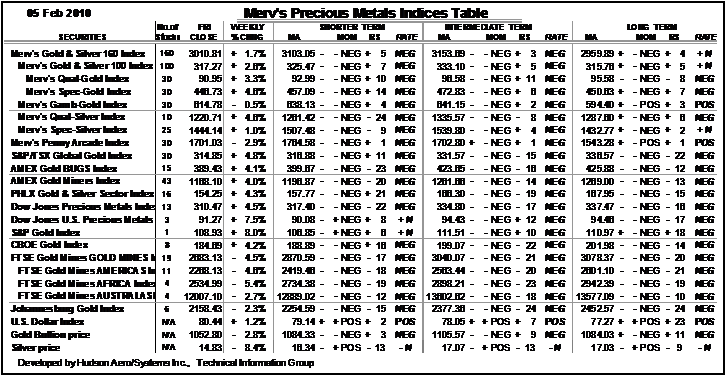
Looking at the technical information for silver in the Table below The ratings of – N for all three time periods just doesn’t seem correct. Based upon a review of the indicators and chart activity I think that these ratings should all be NEG. For now assume they are NEG and I will review the results and correct them for next week, if required.
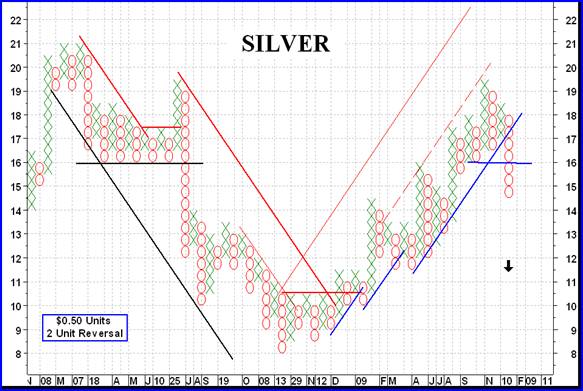
I like the P&F chart for silver. It has been on the money for a long time, except for that attempted reversal in July of 2008 that quickly whip-sawed on us. The loss due to this whip-saw would have been in the order of 11%. The effect would have depended upon how one traded with this information. In this latest bull run the gain from the bull signal to the bear signal was 45%. Again, the gain one might have experienced would have depended upon how one traded upon this information.
The projection for this move takes us back to the support from activities earlier in the year 2009, almost back to the previous upside break level. As often emphasized, the projections are just a guide and not certainties. One should follow the daily or weekly action and take your cues from such activity as far as where a trend ends and when a reversal takes hold.
PRECIOUS METAL STOCKS
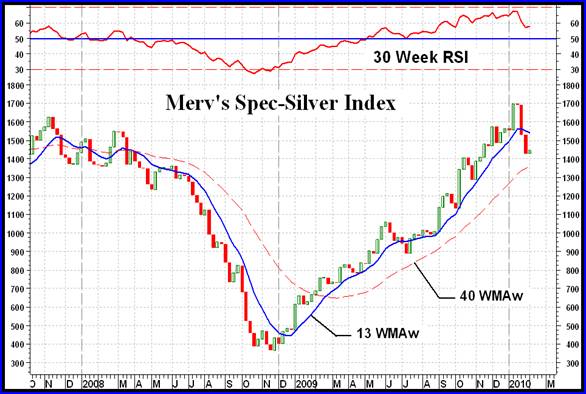
Although there are many Gold Indices flooding around out there one seldom sees a Silver Index. Shown today is my Merv’s Spec-Silver Index. This Index contains 25 speculative stocks primarily those involved with exploration activities, although a few may have operating silver mines. During the past year the average performance of these 25 stocks has been better than 300% but it does look like some reversal of fortunes may be taking place. The long term momentum indicator just about reached the overbought zone so there may still be a sharp rally ahead to get it into the overbought zone similar to the drop into the oversold zone in Oct of 2008 signaling the end of the bear. We will just have to wait and see how this develops. The indicator DOES NOT need to get to the overbought zone to reverse trend, it’s only that if it should get into that area a reversal of trend is almost more assured and one can act accordingly.

Looking at the two Silver Indices in the Table, it’s interesting to note that although the recent commodity action has shown silver to be under performing gold, silver stocks have still been performing better than most gold stocks. There seems to be a little disconnect between the performance of stocks versus the commodity. It just might be a short term thing with no real significance.
It’s also interesting to note the difference in performance between the two silver Indices. While the Spec-Silver Index gained over 300% during this latest bull run the Qual-Silver Index gained just over 200% during the same period and did not come anywhere close to reaching its previous bull market high. The Qual-Silver Index is composed of 10 of the largest silver related stocks trading on the North American markets.
As for the precious metal stocks in general, they took a sharp bounce on Friday, probably late in the day in sympathy with the sudden rise in gold price late in the day. This sharp Friday move resulted in most stocks closing the week on the up side but not really doing much as far as reversing the basic negative trend that has developed over the previous few weeks. It is still a period to be cautious in your trades.
Merv’s Precious Metals Indices Table

Well, that will be it for this week.
By Merv Burak, CMT
Hudson Aero/Systems Inc.
Technical Information Group
for Merv's Precious Metals Central
For DAILY Uranium stock commentary and WEEKLY Uranium market update check out my new Technically Uranium with Merv blog at http://techuranium.blogspot.com .
During the day Merv practices his engineering profession as a Consulting Aerospace Engineer. Once the sun goes down and night descends upon the earth Merv dons his other hat as a Chartered Market Technician ( CMT ) and tries to decipher what's going on in the securities markets. As an underground surveyor in the gold mines of Canada 's Northwest Territories in his youth, Merv has a soft spot for the gold industry and has developed several Gold Indices reflecting different aspects of the industry. As a basically lazy individual Merv's driving focus is to KEEP IT SIMPLE .
To find out more about Merv's various Gold Indices and component stocks, please visit http://preciousmetalscentral.com . There you will find samples of the Indices and their component stocks plus other publications of interest to gold investors.
Before you invest, Always check your market timing with a Qualified Professional Market Technician
Merv Burak Archive |
© 2005-2022 http://www.MarketOracle.co.uk - The Market Oracle is a FREE Daily Financial Markets Analysis & Forecasting online publication.
Comments
|
mighty mite
07 Sep 10, 12:45 |
hmm
meanwhile....gold futures showing 1500 by december. |


