


Clean Energy: Coconuts vs. Swallows of Coal and Natural Gas
Commodities / Energy Resources Feb 21, 2011 - 03:03 AM GMTBy: Dian_L_Chu

 Bill Willoughby writes: There’s a memorable part in the 1970s movie Monty Python & the Holy Grail where King Arthur argues with a guard on a castle wall about whether a swallow could have carried a coconut to England, the punch line being is that an African or European swallow?
Fact checking about birds aside, the point of the story is if you don’t have the ability to lift a coconut you need to increase capacity by adding more swallows, that or find yourself an African swallow.
One Big Coconut - 5 Trillion KWH by 2035
Needless to say, when it comes to generating electricity, we are dealing with a very big coconut.
In 2010, the U.S. Energy Information Administration (EIA) estimates that the U.S. consumed about 4 trillion kilowatt-hours of electricity. By 2035, the year that we are to reach the goal of 80% of our electricity from clean sources, that number will be about 5 trillion kilowatt-hours.
In average electrical generation, we can divide those figures by the total hours in the year and see that, on average, we use about 474 gigawatts (GW) now; and that number will grow to about 587 GW by 2035.
U.S. Electricity Generation – Current State
We can similarly look at the major sources of electricity through EIA’s tables and compare average generation with the capacity of the five major sources of electricity. As with the coconut story, capacity must be greater than the average generation, or else our coconut will be staying on the ground.
But, not only must the capacity be greater, we also need to have a surplus of capacity because the 474 GW is average generation; additional capacity is needed somewhere in the grid to handle those times of day and year when the demand is greater, that is, when our variable weight coconut is heaviest.
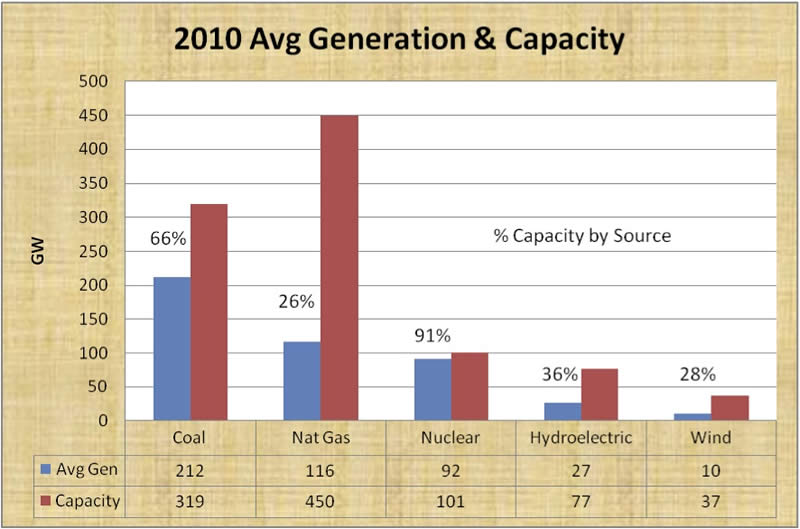
Graph Data from EIA 2011 Forecast Tables
The chart for 2010 (above) shows % capacity, which is average generation divided by the capacity of each source. Some refer to this as the capacity factor; others as overall efficiency because it takes into account all the factors that can affect power generation.
These factors include: mechanical availability (the amount of time a plant can run between breakdowns and maintenance); Mother Nature -- the efficiency of thermal plants on hot or cold days, the ability of a hydroelectric plant to run during high water or drought, or the number of windy days in a year that can sustain a wind farm; flexibility of a plant to start or stop (also called dispatchability); and the cost of the energy sources.
Taken as a whole, these factors influence whether a plant runs all the time and supplies base load to the grid, or during those periods of high demand (heavy coconut) when additional "peaking power" is needed.
In the 2010 chart, we see the highest capacity factors are highest for nuclear and coal, the two primarily sources for base loads, and are much lower for hydroelectric and natural gas, which have the flexibility to serves as the primary providers of peaking power. The low capacity factor for wind, at 28%, reflects mostly the limits of Mother Nature, and does not fall easily into either role of base load or peak generator.
Clean Energy - Changes by 2035
Looking out to 2035, we can see EIA is forecasting no surprising changes in average generation or capacity.
Coal and natural gas are expected to pick up most of the increase in average generation, accounting for 395 GW of the 587 GW required by 2035. Natural gas does so with an increase in capacity that indicates additional new plants will be built, but the capacity factor of 27% indicates natural gas will continue as our primary source of peaking power.
Coal shows no net gain in capacity and an increase in its capacity factor to 78%, a combination which indicates coal plants will be better utilized in base loads and, if additional plants are built, their capacities will be offset by those being retired.
Nuclear, hydroelectric, and wind show relatively minor changes in generation and capacity. The net gain of 10 GW in capacity for nuclear is the equivalent of several new nuclear power plants. Considering the enthusiasm for new dams, one is left wondering where 3 GW in new hydroelectric capacity can come from.
Fans of wind power will recognize that a 19 GW increase in capacity is not a very ambitious goal considering that 20 GW of new wind capacity has been built in the U.S. since 2007 alone. It may be that there is some skepticism regarding the potential to incorporate a large increase in the contribution of wind power to the grid.
Adding together the average generation from the five energy sources gets us to 549 GW of the 587 GW needed by 2035. In EIA’s forecasts, the other 38 GW are found in a variety of other sources, including biomass, solar, and geothermal. Whether these other sources are up to the task, or the balance will be taken up by the major five, remains to be seen.
133 GW Power Play
This brings us to the larger question of how to achieve President Obama's recently stated goal of obtaining 80% of our electricity from "clean" sources by 2035.
In his State of the Union speech, the President spelled out part of the answer when he said that clean sources are: wind and solar, clean coal, natural gas and nuclear. The one item not on the list is plain old coal, as opposed to clean coal. As discussed in my previous post, one approach to the 80% goal is clean coal technologies. But how much new clean electricity do we need?
Taking 80% of 587 GW gives a 2035 target of 470 GW of generation in the clean category. If coal is omitted for the moment, we are left with natural gas, nuclear, hydroelectric, wind and the 38 GW in the Others category, above. All of these are on the clean list and total 337 GW of generation. Subtracting the 337 GW "already clean" from the 470 GW target leaves 133 GW required for new clean electricity.
So, there it is: if you are a power producer, there are 133 clean gigawatts for the taking. Hydroelectric is most unlikely (or say conventional hydroelectric, leaving the option open for tidal power). Nuclear has the potential for additional capacity through more power plants or expansions to existing plants, but faces an uphill battle in permitting. Wind has scope for additional capacity, but, if we look at the capacity factors, the number of new windmills becomes daunting.
Swallows of Coal & Natural Gas?
Among the big five, that leaves us with coal and natural gas.
If clean coal, by which we mean dealing with the carbon dioxide, is not possible, that leaves natural gas. As advocates of natural gas point out, the carbon dioxide emissions are up to 70% less than from coal (which is the reason natural gas is on the clean list) and we have abundant resources, so the potential is there for natural gas to make inroads against coal.
Doing so, however, requires significantly expanding the role of natural gas from peaking power into base loads. Perhaps there is an African swallow on the horizon, but for now, it looks like we are left with coal and natural gas to do the heavy lifting.
Related Reading - Clean Energy: [Coal] Beteen The Lines?
About The Author - Bill Willoughby is a Mining Engineer, and he blogs at Resource and Environment.
Dian L. Chu, M.B.A., C.P.M. and Chartered Economist, is a market analyst and financial writer regularly contributing to Seeking Alpha, Zero Hedge, and other major investment websites. Ms. Chu has been syndicated to Reuters, USA Today, NPR, and BusinessWeek. She blogs at http://econforecast.blogspot.com/.
© 2011 Copyright Dian L. Chu - All Rights Reserved Disclaimer: The above is a matter of opinion provided for general information purposes only and is not intended as investment advice. Information and analysis above are derived from sources and utilising methods believed to be reliable, but we cannot accept responsibility for any losses you may incur as a result of this analysis. Individuals should consult with their personal financial advisors.
© 2005-2022 http://www.MarketOracle.co.uk - The Market Oracle is a FREE Daily Financial Markets Analysis & Forecasting online publication.