Most Popular
1. It’s a New Macro, the Gold Market Knows It, But Dead Men Walking Do Not (yet)- Gary_Tanashian
2.Stock Market Presidential Election Cycle Seasonal Trend Analysis - Nadeem_Walayat
3. Bitcoin S&P Pattern - Nadeem_Walayat
4.Nvidia Blow Off Top - Flying High like the Phoenix too Close to the Sun - Nadeem_Walayat
4.U.S. financial market’s “Weimar phase” impact to your fiat and digital assets - Raymond_Matison
5. How to Profit from the Global Warming ClImate Change Mega Death Trend - Part1 - Nadeem_Walayat
7.Bitcoin Gravy Train Trend Forecast 2024 - - Nadeem_Walayat
8.The Bond Trade and Interest Rates - Nadeem_Walayat
9.It’s Easy to Scream Stocks Bubble! - Stephen_McBride
10.Fed’s Next Intertest Rate Move might not align with popular consensus - Richard_Mills
Last 7 days
Stocks Correct into Bitcoin Happy Thanks Halving - Earnings Season Buying Opps - 4th July 24
24 Hours Until Clown Rishi Sunak is Booted Out of Number 10 - UIK General Election 2024 - 4th July 24
Clown Rishi Delivers Tory Election Bloodbath, Labour 400+ Seat Landslide - 1st July 24
Bitcoin Happy Thanks Halving - Crypto's Exist Strategy - 30th June 24
Is a China-Taiwan Conflict Likely? Watch the Region's Stock Market Indexes - 30th June 24
Gold Mining Stocks Record Quarter - 30th June 24
Could Low PCE Inflation Take Gold to the Moon? - 30th June 24
UK General Election 2024 Result Forecast - 26th June 24
AI Stocks Portfolio Accumulate and Distribute - 26th June 24
Gold Stocks Reloading - 26th June 24
Gold Price Completely Unsurprising Reversal and Next Steps - 26th June 24
Inflation – How It Started And Where We Are Now - 26th June 24
Can Stock Market Bad Breadth Be Good? - 26th June 24
How to Capitalise on the Robots - 20th June 24
Bitcoin, Gold, and Copper Paint a Coherent Picture - 20th June 24
Why a Dow Stock Market Peak Will Boost Silver - 20th June 24
QI Group: Leading With Integrity and Impactful Initiatives - 20th June 24
Tesla Robo Taxis are Coming THIS YEAR! - 16th June 24
Will NVDA Crash the Market? - 16th June 24
Inflation Is Dead! Or Is It? - 16th June 24
Investors Are Forever Blowing Bubbles - 16th June 24
Stock Market Investor Sentiment - 8th June 24
S&P 494 Stocks Then & Now - 8th June 24
As Stocks Bears Begin To Hibernate, It's Now Time To Worry About A Bear Market - 8th June 24
Gold, Silver and Crypto | How Charts Look Before US Dollar Meltdown - 8th June 24
Gold & Silver Get Slammed on Positive Economic Reports - 8th June 24
Gold Summer Doldrums - 8th June 24
S&P USD Correction - 7th June 24
Israel's Smoke and Mirrors Fake War on Gaza - 7th June 24
US Banking Crisis 2024 That No One Is Paying Attention To - 7th June 24
The Fed Leads and the Market Follows? It's a Big Fat MYTH - 7th June 24
How Much Gold Is There In the World? - 7th June 24
Is There a Financial Crisis Bubbling Under the Surface? - 7th June 24

Market Oracle FREE Newsletter

How to Protect your Wealth by Investing in AI Tech Stocks

Barron’s Gold Mining Index To Double Over The Next Couple Of Years?

Commodities / Gold & Silver Stocks Mar 15, 2012 - 07:57 AM GMT

By: Hubert_Moolman

Commodities

The behaviour of gold stocks during this gold bull market is really not that different to the gold bull market of the 70s. It was not until almost the end of the bull market (in 1979) that the gold stocks really started to take-off. Those who think gold stocks will not rise during this bull market will be disappointed, and need to consider the evidence presented here.


Below, is a long term chart (from sharelynx.com) for the Barron’s Gold Mining Index (BGMI):

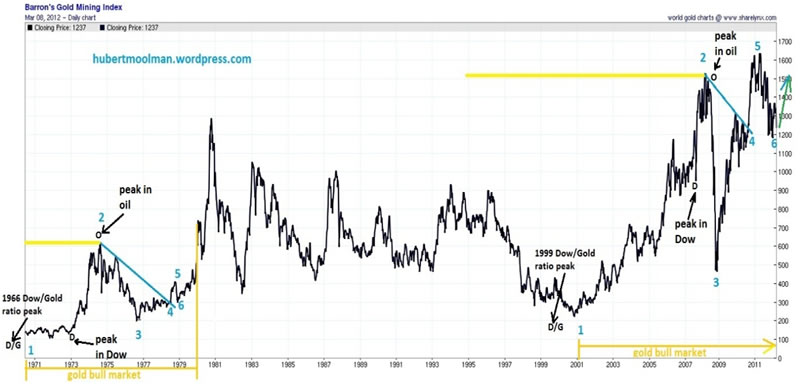
On the chart, I have highlighted two fractals (or patterns), marked 1 to 6, which appear similar. What makes these two fractals so special is the similarity of the circumstances in which they exist.

Both patterns started where the Dow/Gold ratio peaked, as well as where the gold bull markets started.

There was a significant peak in the Dow (1973 and 2007) between point 1 and 2 of both fractals. Both peaks in the Dow came about 7 years after the peak in the Dow/Gold ratio. After point 2, on both fractals, the oil price made a significant peak (1974 and 2008), about 8 years after the peak in the Dow/Gold ratio.

Based on the fractals on the chart, we could still have more than two years before we could get a top in the BGMI, like we had at the end of 1980. That is more than 14 years after the Dow/Gold ratio top (beginning of 1966 to the end of1980 vs the end of 1999 to some time in 2014).

If you compare the two patterns, then it seems we are currently just past point 6, which is similar to the beginning of 1979. The correction since the beginning of 2011 is in the closing stages, and price should advance significantly over the next couple of years. If the patterns continue their similarity, then we should expect the BGMI to reach levels more than double its current peak.

In a previous article, I have illustrated why current levels could be a good time to buy gold stocks (HUI).

For more detailed analysis of gold, silver and the Dow, you are welcome to subscribe to my free or premium service.

Warm regards and God bless,

Hubert

http://hubertmoolman.wordpress.com/

You can email any comments to hubert@hgmandassociates.co.za

© 2012 Copyright Hubert Moolman - All Rights Reserved

Disclaimer: The above is a matter of opinion provided for general information purposes only and is not intended as investment advice. Information and analysis above are derived from sources and utilising methods believed to be reliable, but we cannot accept responsibility for any losses you may incur as a result of this analysis. Individuals should consult with their personal financial advisors.


© 2005-2022 http://www.MarketOracle.co.uk - The Market Oracle is a FREE Daily Financial Markets Analysis & Forecasting online publication.


Post Comment

Only logged in users are allowed to post comments. Register/ Log in