Simple Index Called Gold 1980 Top, Now Points to At Least $3,000
Commodities / Gold and Silver 2012 Mar 16, 2012 - 06:59 AM GMTBy: Submissions
Dincer YILMAZ writes: The ultimate function of gold is being money. Therefore it is natural that value of gold against other currencies responses to supply-demand laws. If a competitor currency (for example US dollar) becomes relatively abundant than gold, one can expect gold to appreciate against the other currency. On the other hand, the same competitor currency can offer advantageous real rates to investors and depositors, so gold depreciates this time due to higher demand for the other currency even if the other currency’s supply growth rate exceeds gold’s supply growth rate.
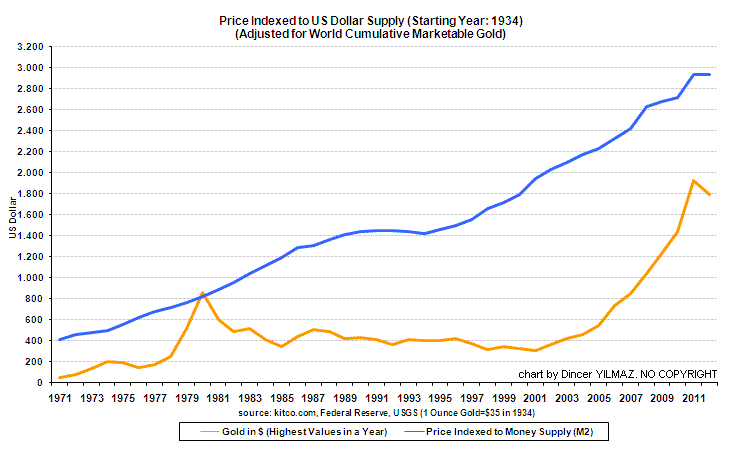
Below chart plots gold prices in US dollars and the price indexed to US (M2) money supply starting from 1934. Indexed price is adjusted for world cumulative marketable gold. “Marketable” gold represents all forms of gold excluding consumed metal (dentistry, electronics, etc.), production losses, historical artifact, works of art, very valuable and unique inheritable jewelry (especially in India), medals and other souvenir, numismatics, and unexplored treasures. (According to USGS non-marketable gold amounts to 15% of all gold ever mined) Spot gold prices in USD are the highest values in each year.

Indexed price is calculated as follows: at the beginning of 1934, the amount of global marketable gold stands at approximately 40,000 metric tons. (1934 is the year when Roosevelt revalued gold to $35/ounce and remained there till 1970s) Throughout 78 years, the amount of total global marketable gold had risen to 143,000 metric tons. (Source: US Geological Survey) FED’s Banking and Monetary statistics published in 1941 estimates money supply as 32.2 billion dollars at the beginning of 1934. The most recent M2 money supply figure (February 2012) stands at 9.76 Trillion dollars. Today’s cumulative marketable gold adjusted indexed price equals:
[($9.76 Trillion / $32.2 billion) / (143,000 tons / 40,000 tons)] * $35 = ~ $3,000
Please notice that spot gold price touched our indexed price in 1980 for a very brief period. Then demand for dollar had increased as a result of advantageous real interest rates (average real rates were near +4% during 1980s) and gold entered 20 years-long bear market in a typical disinflationary environment.
Gold price of $3,000/ounce is valid in a scenario where USD supply growth rate will be in sync with gold’s. Make no mistake: (1) it is nearly impossible for Bernanke to keep US dollar supply growth rate from exceeding gold supply growth rate, which is very stable. (2) It is also out of question that U.S. banks and Treasury can afford to offer satisfactory real rates to investors and depositors in the foreseeable future.
Truth be told, my analysis is a simple numerical one and has no claim to be “scientific”. Of course there are many additional factors to take into consideration, e.g. global money supply figures, emerging market demand, permanent backwardation risk in paper gold market, concerns over central bank credibility, a possible Eurodollar crisis due to looming collapse of Euro, surprise central bank gold sales or purchases etc. We will wait and see whether the index proves itself to be of use again.
Dincer YILMAZ, CPA
E-mail of the Author: yilmadin@yahoo.com
A Short bio: Dincer Yilmaz is a senior CPA. He is not a professional astrologer or financial analyst. He is living in Istanbul, Turkey and can be reached at yilmadin@yahoo.com.
© 2012 Copyright Dincer YILMAZ - All Rights Reserved
Disclaimer: The above is a matter of opinion provided for general information purposes only and is not intended as investment advice. Information and analysis above are derived from sources and utilising methods believed to be reliable, but we cannot accept responsibility for any losses you may incur as a result of this analysis. Individuals should consult with their personal financial advisors.
© 2005-2022 http://www.MarketOracle.co.uk - The Market Oracle is a FREE Daily Financial Markets Analysis & Forecasting online publication.


