


Stock Market Uptrend Resumes
Stock-Markets / Stock Markets 2013 Feb 24, 2013 - 03:57 PM GMTBy: Tony_Caldaro

 Market surprises with a volatile week. After hitting a new uptrend high on tuesday, the market sold off about 2% to a thursday low, before rallying to end the week. For the week the SPX/DOW were mixed, and the NDX/NAZ lost 1.0%. Asian markets were -0.7%, European markets were -0.2%, and the DJ World index lost 0.5%. Economic reports for the week had a negative bias for the first time in many weeks. On the uptick: building permits, the PPI, leading indicators and the monetary base. On the downtick: the NAHB, housing starts, existing home sales, the Philly FED, the WLEI and weekly jobless claims rose. Next week we get a look at Q4 GDP, (est. +0.5%), personal income/spending, PCE and the ISM.
LONG TERM: bull market
Another week another bull market high. The bull market continues to unfold with a few short/medium term surprises here and there along the way. We continue to count this nearly four year bull market as Cycle wave [1] of the next multi-decade Supercycle bull market. Cycle wave bull markets unfold in five Primary waves. Primary waves I and II completed in 2011. Primary wave III has been underway since that low. Primary I divided into five Major waves with a subdividing Major wave 1. Primary III is also dividing into five Major waves, but both Major 1 and 3 are subdividing.
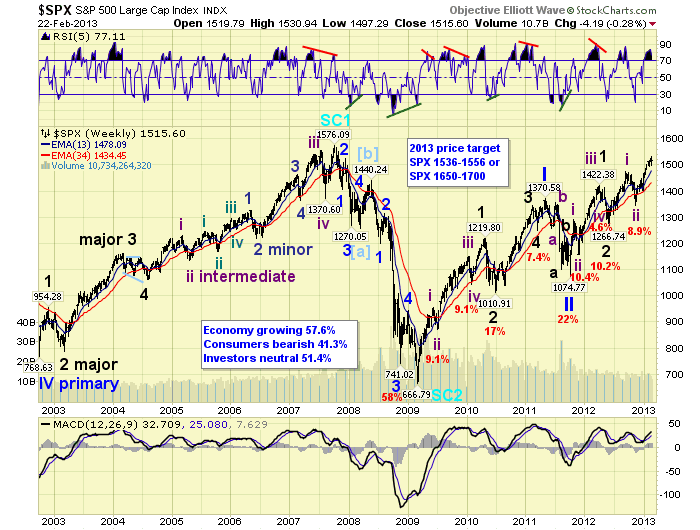
Major waves 1 and 2 of Primary III completed in 2012. Major wave 3 has been underway since that low. Within Major 3 we have already completed Intermediate wave i and ii. Intermediate wave iii has been under since the late 2012 Int. wave ii low. When this uptrend, Int. wave iii, concludes we should see about a 4% correction for Intermediate wave iv. Then another uptrend will complete Major 3. After a more substantial Major wave 4 correction, a Major wave 5 should complete Primary III. Finally, after a Primary wave IV correction, Primary wave V should end the bull market. We are still expecting the bull market to end this year, or early next, most likely above all time new highs.
MEDIUM TERM: uptrend
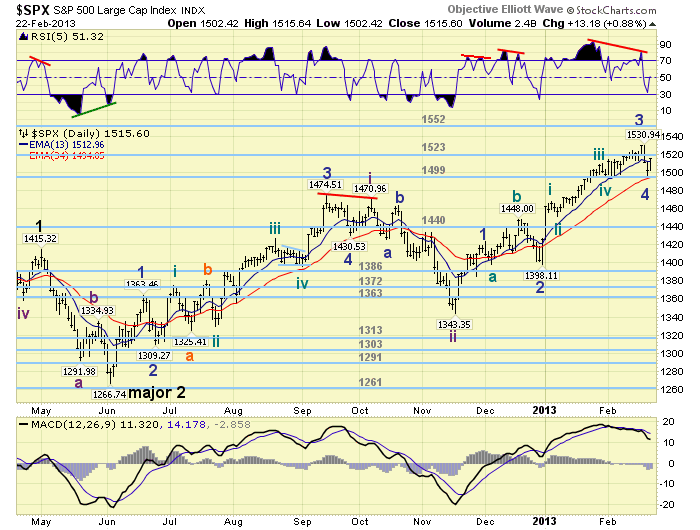
In has certainly been an interesting uptrend from the Int. wave ii low at SPX 1343. At first Minor wave 1 was shortened at SPX 1424, due to the fiscal cliff drama. Then Minor wave 2 formed an irregular flat: 1398-1448-1398. After that, on the last trading day of 2012, Minor wave 3 got underway and quickly started to subdivide. And subdivide and subdivide. Then when it got most of us market pundits lost in all the subdivisions it ended at SPX 1531. When it did end, Minor 4 wasted little time in getting underway: dropping 34 points in just two days.
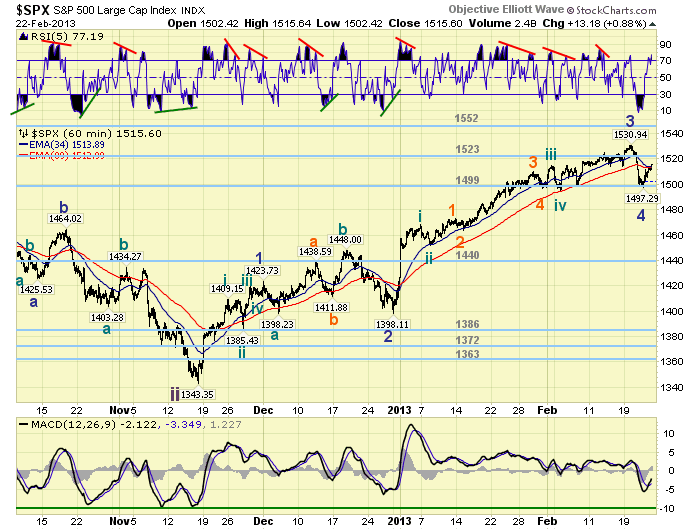
At the SPX 1497 low, the market hit all the technical parameters we had been expecting for a Minor 4 pullback: 30+ point pullback, an oversold condition on the daily RSI, extremely oversold on the hourly RSI, a decline to the OEW 1499 pivot range, and more. We then posted a green tentative Minor 4 label at SPX 1497. We also suggested a strong rally through SPX 1506 should confirm the low is probably in. The market gapped up on friday, retested that level and closed at the highs of the day. At the close we upgraded the Minor 4 label to its appropriate dark blue. Minor wave 5 should be underway. Medium term support is at the 1499 and 1440 pivots, with resistance at the 1523 and 1552 pivots.
SHORT TERM
Short term support is at the 1499 pivot and SPX 1471/75, with resistance at the 1523 and 1552 pivots. Short term momentum ended the week slightly overbought. The short term OEW charts are now positive with the reversal level at SPX 1515.
Minor wave 3 was a bit tricky to decipher, but in the end it had an impulsive 17 waves up from SPX 1398. The pullback, while only two days, held support at a short term support cluster: 1497, 1495, 1498, and the OEW 1499 pivot. Reviewing Minor waves 1 through 4 provides us with some potential targets for Minor wave 5. We had been targeting the OEW 1552 pivot all during this uptrend. Let’s see if it still fits.
Minor wave 1 was 81 points (1343-1424), and Minor wave 3 was 133 points (1398-1531). This wave relationship suggest Minor 5 can be 30+ points, 50+ points, or even 80+ points. From the Minor 4 SPX 1497 low this projects: 1527+, 1547+ and 1577+. Clearly the SPX 1527+ is too low and would create a truncated/failed fifth wave. Not expecting that after all the Minor 3 subdivisions. SPX 1547+ is right within the range of the OEW 1552 pivot. SPX 1577+ is right within the range of the all time high at SPX 1576, with is also an OEW pivot. So the uptrend could hit either the 1552 pivot or the 1576 pivot for a Minor 5 high to end this Intermediate wave iii uptrend. But let’s look out a bit further.
When this uptrend ends the market will correct, downtrend, in Intermediate wave iv. The recent Int. wave iv’s have corrected between 4% and 5%, or about 60 to 75 SPX points. If this uptrend ends within the 1552 pivot range, Int. wave iv could then correct to about 1475. Right near the high of Int. i, and quite close to overlapping it. Not good. If the uptrend ends within the 1576 pivot range, a 75 point correction would take it to 1500. This is okay. When we review the spreads between the lows of previous Int. iv’s and the highs of Int. i’s the smallest spread has been 44 points. Or, in our current situation around a SPX 1519 low. If the Minor wave 5 rallies to the OEW 1576 pivot to complete Int. iii. Then corrects 4% during Int. wave iv. The low will fit within previous spreads, will have the right correction percentage, and will not only hit resistance at an OEW pivot (1576), but will find support at one (1523) as well. Let’s upgrade our target for this uptrend to the SPX 1576 pivot. Best to your trading!
FOREIGN MARKETS
The Asian markets were mixed on the week for a loss of 0.7%. India and S.Korea are in downtrends, with S. Korea improving, but both China and Hong Kong are weakening.
The European markets were mostly higher but ended with a 0.2% loss. France, Germany, Italy, Spain and the Stox are all in downtrends.
The Commodity equity group were mostly lower for a loss of 1.0%. Brazil is downtrending and Russia is weakening.
The DJ World index is still uptrending but lost 0.5% on the week.
COMMODITIES
Bonds are still downtrending but are beginning to display some improvement. On the week they gained 0.3%.
Crude is weakening and lost 1.9% on the week.
Gold resumed it downtrend losing 2.1% on the week.
The USD is uptrending and gained 1.1% on the week.
NEXT WEEK
Tuesday kicks off the week with: Case-Shiller, the FHFA housing index, New home sales and Consumer confidence. Wednesday: Durable goods orders, and Pending home sales. Thursday: Q4 GDP, weekly Jobless claims, and the Chicago PMI. Friday: Personal income/spending, the PCE, Consumer sentiment, ISM manufacturing, Construction spending, and Auto sales. As for the FED. FED chairman Bernanke testifies before the senate and congress at 10:00 on tuesday/wednesday with the semiannual monetary report. Then on thursday there’s a speech from FED governor Raskin at 12:30. Best to your weekend and week!
CHARTS: http://stockcharts.com/...
http://caldaroew.spaces.live.com
After about 40 years of investing in the markets one learns that the markets are constantly changing, not only in price, but in what drives the markets. In the 1960s, the Nifty Fifty were the leaders of the stock market. In the 1970s, stock selection using Technical Analysis was important, as the market stayed with a trading range for the entire decade. In the 1980s, the market finally broke out of it doldrums, as the DOW broke through 1100 in 1982, and launched the greatest bull market on record.
Sharing is an important aspect of a life. Over 100 people have joined our group, from all walks of life, covering twenty three countries across the globe. It's been the most fun I have ever had in the market. Sharing uncommon knowledge, with investors. In hope of aiding them in finding their financial independence.
Copyright © 2013 Tony Caldaro - All Rights Reserved Disclaimer: The above is a matter of opinion provided for general information purposes only and is not intended as investment advice. Information and analysis above are derived from sources and utilising methods believed to be reliable, but we cannot accept responsibility for any losses you may incur as a result of this analysis. Individuals should consult with their personal financial advisors.
Tony Caldaro Archive |
© 2005-2022 http://www.MarketOracle.co.uk - The Market Oracle is a FREE Daily Financial Markets Analysis & Forecasting online publication.