


Stock Market No Confirming Signal for a Top, Yet
Stock-Markets / Stock Markets 2013 May 27, 2013 - 01:36 PM GMTBy: Michael_Noonan

 There is a reason why the trend is the most important consideration when positioning
in any market. The number of profitable shorts, as of last week, can still be counted on
one hand, at least those who remain amongst the ranks of the devastated ones still trying
to pick a top. The most money is lost picking tops and bottoms, but top-pickers are always
at odds with that fact. Richard Dennis lost more money trying to buy sugar under 5 cents
than he did buying at higher prices on previous occasions. He ranks as a poster child for
money lost in bottom-picking, and he was a highly regarded professional player.
There is a reason why the trend is the most important consideration when positioning
in any market. The number of profitable shorts, as of last week, can still be counted on
one hand, at least those who remain amongst the ranks of the devastated ones still trying
to pick a top. The most money is lost picking tops and bottoms, but top-pickers are always
at odds with that fact. Richard Dennis lost more money trying to buy sugar under 5 cents
than he did buying at higher prices on previous occasions. He ranks as a poster child for
money lost in bottom-picking, and he was a highly regarded professional player.
No matter. Top-picking egos have been clamoring for a top over the past several months. Like a stopped clock, one day they will be right. We prefer to let the markets reveal their message and respond to it, rather than front-run it.
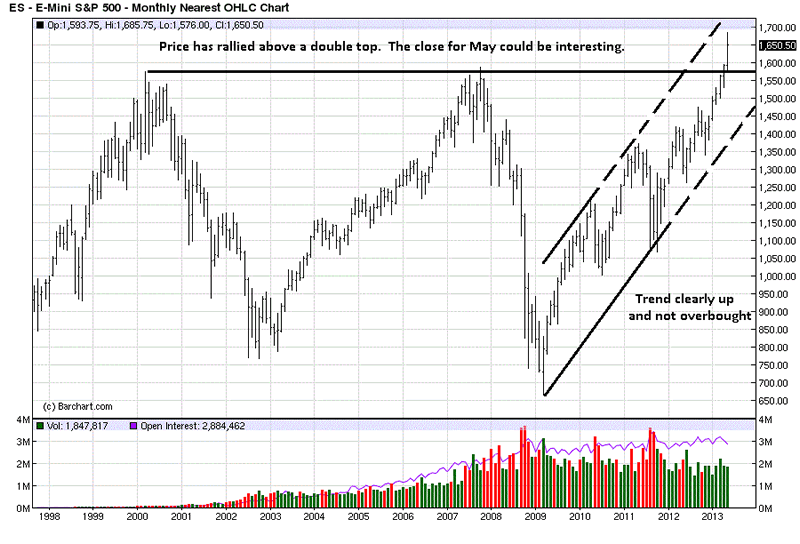
What will be evident in viewing charts from over three time frames, monthly, weekly, and daily, is that the trend is unequivocally up, and that is a strong statement from the market.
Where many may have anticipated the possibility of a triple top, the Fed-driven market sailed right through what would normally be resistance. One has to remember that the anticipated resistance was just potential, and it had to be confirmed by market activity showing signs of weakness and reversal behavior. It never happened.
The failure of a triple top is a great example of why one should follow the message from developing market activity and not front-run and get run over in the process. The channel shows that there is still room to rally without being in an overbought condition. What may provide valuable information will be the location of the close by the end of the week. A strong close will mean continuation. A weak close could signal a possible turn, but it takes time to turn a trend, so one does not have to be the first one in.
The dashed portion of the channel represents future support/resistance, once the first three points are established, the two swing lows in 2009 and 2011, forming the bottom support line, and a line parallel to it using the swing high between those points, 2010.
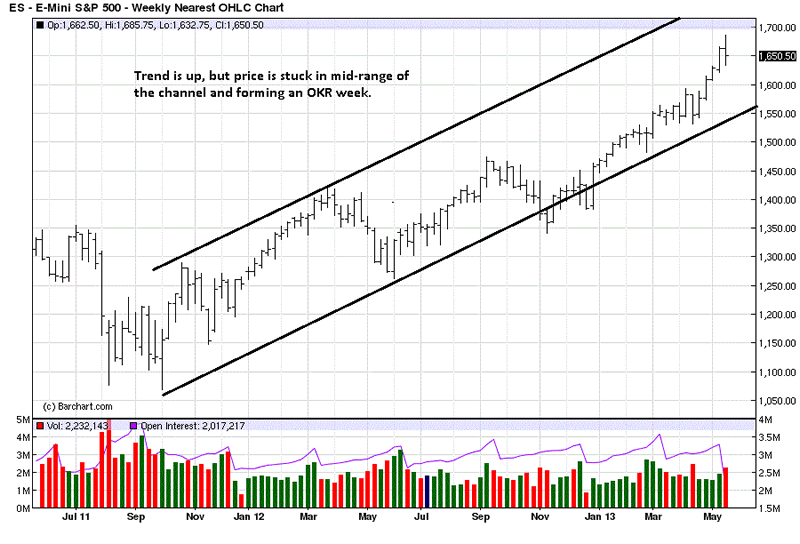
What has many bears-in-waiting salivating is the weekly Outside Key Reversal [OKR]. Just like one swallow does not a summer make, nor does a single bar necessarily reverse a trend. It may lead to a trend reversal, but further proof of confirming market activity is required.
What is interesting about the weekly chart is the location of current price activity within the channel. It is not reaching the top of the channel. The OKR is occurring at the mid- point of the channel, generally a sign of a weakening trend. An important issue with that observation is the fact that price also failed at a similar mid-point back in September of 2012 and was still able to keep the trend intact.
It is simply a piece of information of which to be aware.
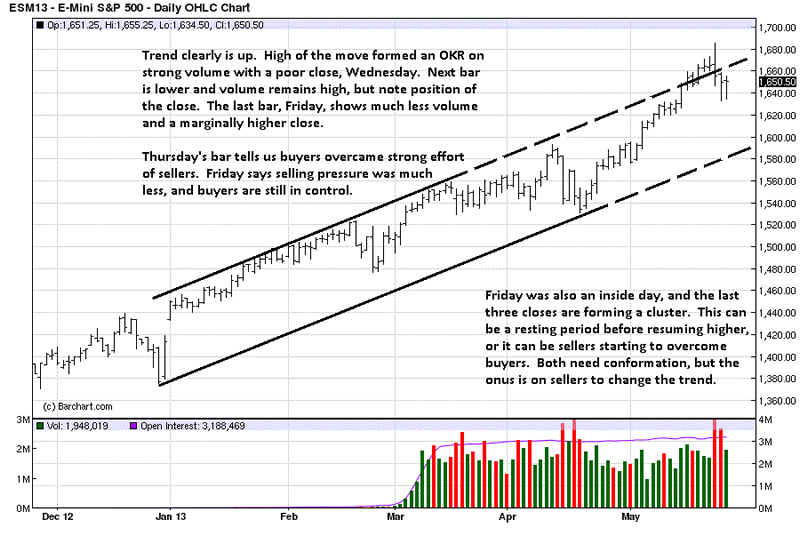
An OKR also developed on the daily chart, last Wednesday, 3rd bar from the right. The volume was exceptionally strong. Volume was also strong the next day, with a lower high, lower low, and lower close, but note the location of the close. It was at the upper end of the bar, and that is the market telling us that despite the increased volume and effort to drive price lower, buyers were in control by the end of the day.
If an OKR at a [potential] high is a sign of weakness, more weakness should follow. The exact opposite happened, as noted on Thursday. This reflects the power of a trend and how it takes a lot of effort to reverse it.
Friday’s close showed a drop in volume, and that equates to a lack of follow-through selling pressure. The upper end close shows buyers still in control. Unless and until weakness enters the picture, one has to respect the trend. If long, one would want to be moving up stops on all stock positions for protection, in case a turn does develop.
As for being short, it may be appropriate for individual stocks that have been under- performing the current market rally, but there is no reason for shorting the market at current levels. What can never be known in advance is how future price activity will develop. The trend, [and Fed effort], may not be over, and based upon how the market has been up, up, and still up since September 2011, it is a message not to be ignored.
If more weakness enters the market next week, or sometime soon after, there will be ample time to take a short position when a turn in trend says it makes sense, to then make dollars from that side of the market.
One interesting piece of factual information is the last two times the S&P traded at an all-time new high and reversed downward to close more than 1% below the high were at the March 2000 and October 2007 highs. Will the same hold true this time around? If it does, we will see market weakness to substantiate it.
Let the market be your guide. It never disappoints, unless its message is disregarded.
By Michael Noonan
Michael Noonan, mn@edgetraderplus.com, is a Chicago-based trader with over 30 years in the business. His sole approach to analysis is derived from developing market pattern behavior, found in the form of Price, Volume, and Time, and it is generated from the best source possible, the market itself.
© 2013 Copyright Michael Noonan - All Rights Reserved Disclaimer: The above is a matter of opinion provided for general information purposes only and is not intended as investment advice. Information and analysis above are derived from sources and utilising methods believed to be reliable, but we cannot accept responsibility for any losses you may incur as a result of this analysis. Individuals should consult with their personal financial advisors.
Michael Noonan Archive |
© 2005-2022 http://www.MarketOracle.co.uk - The Market Oracle is a FREE Daily Financial Markets Analysis & Forecasting online publication.