


No Containing The Energy Subprime Rout
Commodities / Energy Resources Feb 02, 2014 - 12:05 PM GMTBy: Andrew_McKillop

 The Financial Subprime Model
The 2008 global financial crisis was “contained”, or at least plausibly denied for over 2 years before it went critical and caused a global stock market, financial, banking and economic crisis – the effects of which we are still living with, today. As Doug Short wrote this week on Market Oracle: “Contained” was the buzz word used to describe the U.S. subprime crisis in 2006-2007 until it was undeniable in 2008 that it was most certainly not contained. So then, the trillion dollar question is, how does one determine when a crisis is contained or developing into a contagion?” Incredible or unexpected price and production swings by double-digit percentage leaps, is one indicator
Back in early 2006 the US subprime mortgage market began to display rising mortgage defaults. By late 2006 this had impacted and pushed down US housing and real estate prices after a near-decade of fast growth, at rates far above general inflation as measured by consumer price rises (CPI). By 2007, prime or regular mortgage markets were also showing rising default rates. Massive quantities of financial assets pinned on the growth of both types of mortgages featured CMOs or collateralized mortgage obligations, a variant of CDOs or collateralized debt obligations. Alongside CDSs or Credit Default Swaps these were the main transfer mechanisms of the lost value and confidence – and loss of collateral – in the financialized real estate sector, to the general financial, banking and insurance sectors, and then to the overall economic system and all related markets.
By mid-2008 this was a worldwide banking, finance and economic crisis, despite its origins only concerning about 7.5 million US housebuyers who had received subprime loans but had no realistic ability to ever pay back their loans. The global slump from mid-2008 caused a wave of banking crises and massive falls in nominal paper value for assets of all kinds – including oil and energy. In 2007-2008 oil futures traded on major markets like New York's Nymex reached an all-time peak of about $147 per barrel. At the bottom of the asset slump in 2009 they had fallen to about $39 per barrel.
From little nuggets of panic, big crises grow.
Rebound and Slump
From the 2009 nadir, financial assets and especially stocks and shares, and oil, were expanded or “rebounded” in nominal paper value so fast and so much, on the back of massive central bank QE and government bailouts, that the world's stock and energy asset markets are now sitting on another time bomb of artificial value and misplaced confidence, waiting to implode. Energy sector assets including everything from US shale oil and gas drilling land concessions, oil and gas pipelines and other transport assets such as power grids, LNG terminals and tankers, CO2 permits and carbon finance, oilfield equipment and supplies, electric smart metering equipment, windfarm towers and mill components, and solar cell manufacturing assets were all at one stage or another “recovered” by the rebound starting in 2009. To be sure, the asset growth was at least as extreme, unreal and unrelated to economic fundamentals as the general financial asset recovery.
The post-crisis bull market for energy sector assets has its own special features, to be sure, but current extremely overvalued energy assets have the basic underlying need for extreme-high final market and consumer energy prices, or the prospect of growing prices. The US mortgage subprime boom had the basic need of constantly rising, and high real estate prices.
The only question today is whether the pile of general financial assets, or those in the energy sector, will tumble first, and if we get a global energy subprime crisis, can this trigger a worldwide economic slump? Reasons why “the energy subprime” crisis is imminent have starkly clear proofs out there in the thing called the real world, and the copybook example is the US shale gas boom-and-slump.
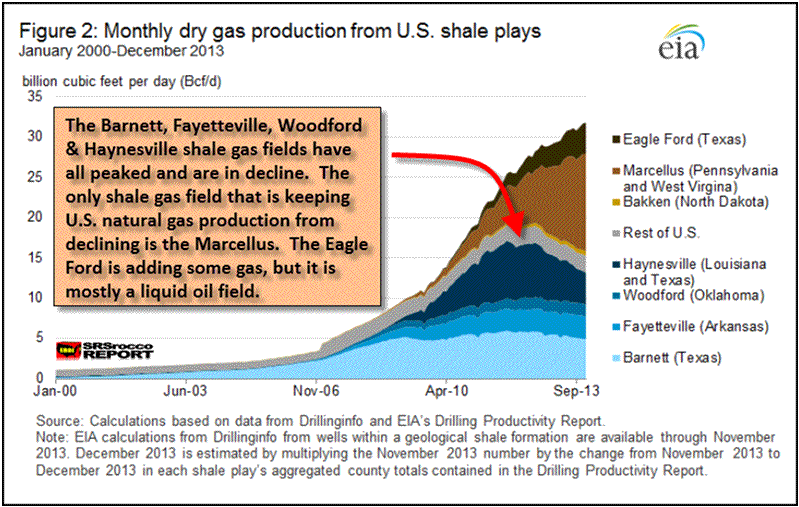
The likely near-term peak of gas production as shale oil output continues to advance is explained by the ultra-simple energy market fact that crude oil trades at close to (WTI) or above (Brent) $100 a barrel, but a million BTU of gas in the US struggles to attain $30 per barrel equivalent of energy ($5 per million BTU). Consequently there is no economic base to spending on investment-dependent gas separating, collection and pipeline transport equipment and infrastructures. Some estimates place the total amount of gas now flared or vented in the Bakken field at 30% of the field's total gas output.
The energy sector's financialized assets are now under attack due to lack of confidence and uncertainty in the “asset value growth paradigm”. They can implode the same way as all other financial assets are dragged down in the inevitable sequel to a debt-based, speculative asset boom that is unrelated to the real economy and its fundamentals.
In exactly the same way as housing and real estate, energy prices and energy asset values have a fundamental driver in the health of the general economy and the global demand for energy of all kinds. If this demand is growing slowly, or is not growing at all, runaway growth in derived energy financial assets will at some time hit a brick wall. This is supposedly a “surprise”.
Firewalls and Bulkheads
The notion of “compartmentalized” firewalls and bulkheads inside the economy was often used during the prelude to the 2006-2007 US subprime crisis to claim there was no crisis, and everything was fine. This completely ignores the role of financialization and debt-related “financial instruments” spanning the entire finance-banking-insurance sector. Exactly the same applies in the energy sector.
Financial Herd faith-based arguments about “firewalls” are used to claim that energy sector assets are not overpriced, not heavily distorted or badly priced, and that global energy prices “can only grow”. One classic example is the notion that while US shale gas is moving rapidly towards a crisis stage, and US natural gas prices are extremely low, high or very high gas prices outside the US, high oil prices everywhere, and extreme-high electricity prices in Europe will somehow act as firewalls and stem any general sector-wide financial crisis across the energy sector. Spurious arguments are made that high energy prices can themselves spur or accelerate general economic growth, when one fundamental analytic base of stock market cycles and asset boom-slump sequences concerns the cost of essentials like food and energy, and the amount of “discretionary spending” able to power asset growth in other sectors of the economy.
High and constantly growing energy prices are however the key collateral for the energy subprime, like growing house prices were for the mortgage subprime crisis. When energy prices decline or slump, this will sooner or later impact energy asset prices. Market rigging as an attempt to prevent this happening is a highly logical result and is operated every day.
In the week ending 24 January, US natural gas prices made a “surprise recovery” but with probably low staying power, growing by 20% in one week. Henry Hub prices reached about $5.15 per million BTU, equivalent to oil at $30.04 a barrel. Reeling back the story to 2010, the last time US gas was priced at $30.04 per barrel of oil equivalent, the “shale gas revolution” had gone critical and was running riot.
Today, the sequels are coming fast. The US “shale gas revolution” was based on a no-holds-barred drilling frenzy, with a linked land grab as drilling concession prices soared like something from a Thorsten Veblen tale of late-19th century capitalistic madness. Drilling concessions were changing hands at several thousand dollars per acre for multi-square-mile patches! In many cases, no drilling of any kind took place on the concessions – due to financial overhead costs, low gas prices and no gas transport infrastructures for “dry gas” plays.
Overall, the US fracking boom went into overdrive and natural gas output grew at double-digit annual rates. With no surprise at all US gas prices suffered a collapse, falling to a historic low of $1.92 per million BTU in 2012. In Asia and Europe, conversely, gas prices in 2012 were as high as $17 per million BTU.
The Volatility Prop and Paradigm
Between the low-high extremes for global gas in 2012 of about $2 and $17 for a million BTU, we could argue the “rational price” has to exist, and is neither of the extremes. For market traders of course, price volatility is an article of faith and source of profit, as well as trading thrills, but for market operators and especially political deciders, market volatility is feared due to rising volatility usually meaning that overpriced financial assets will slump. Volatility aids the process of speculative asset growth, but then turns into a two-edged sword which slays the beast!
Telltale signs of “asset value correction” are now widespread in the energy “patch”. For example the well-publicised financial woes and investor concerns of Royal Dutch Shell and the financial meltdown in US shale gas. Extreme high energy asset prices, and extreme high energy prices – except when they are absurdly low like US shale gas – are other telltale signs. Corporate borrowing by Big Energy to finance an asset buying spree is another sign, all of it predicated on extreme high energy prices holding forever. If they do not, for example the current threat of so-called feed-in tariffs for electricity in Europe being reduced or even terminated (as in Spain), governments will almost certainly have to deal with “troubled assets” in the energy sector, and provide financial support.
How the US subprime happened is a simple question, with not-simple answers. Apart from the belief or hope that real estate prices “could only grow” the 2008 subprime rout concerned the inevitable sequels to an explosion of corporate and private debt – finally responded to by more debt, of the public kind.
Before the subprime crash, any kind of asset relating to US realty was a go-go betting chip. After the crash, the chips were worth nothing. This is the sequence which now threatens Big Energy, which in the period since 2000 responded to “challenges” like peak oil and climate change, OPEC unwillingness to hand out drilling concessions, dependence on Russian oil and gas, and other real or imaginary problems - by financializing itself.
Asset price volatility is now inherent and intrinsic, which is made even more certain by energy sector financialization being a process where derived “can't lose” energy assets are fabricated and traded. At the end of the day, when a “major correction” of asset prices ensues, we can be certain that shareholders, taxpayers and consumers will be paying for the energy subprime rout, in the same way as they are still today paying for the post-2008 financial subprime rout, one way and another.
By Andrew McKillop
Contact: xtran9@gmail.com
Former chief policy analyst, Division A Policy, DG XVII Energy, European Commission. Andrew McKillop Biographic Highlights
Co-author 'The Doomsday Machine', Palgrave Macmillan USA, 2012
Andrew McKillop has more than 30 years experience in the energy, economic and finance domains. Trained at London UK’s University College, he has had specially long experience of energy policy, project administration and the development and financing of alternate energy. This included his role of in-house Expert on Policy and Programming at the DG XVII-Energy of the European Commission, Director of Information of the OAPEC technology transfer subsidiary, AREC and researcher for UN agencies including the ILO.
© 2014 Copyright Andrew McKillop - All Rights Reserved Disclaimer: The above is a matter of opinion provided for general information purposes only and is not intended as investment advice. Information and analysis above are derived from sources and utilising methods believed to be reliable, but we cannot accept responsibility for any losses you may incur as a result of this analysis. Individuals should consult with their personal financial advisor.
Andrew McKillop Archive |
© 2005-2022 http://www.MarketOracle.co.uk - The Market Oracle is a FREE Daily Financial Markets Analysis & Forecasting online publication.