


Stock Market Flux Capacitor Forecast
Stock-Markets / Stock Markets 2014 Nov 26, 2014 - 01:36 AM GMTBy: Ed_Carlson

It feels as if we've been here before. The previous forecast for a high to the right shoulder on 9/19/14 looked good but was obviously incorrect (on the other hand, it was followed by a drop of 1,163 points in the Dow). The evidence pointing to that high was like a Ford Edsel compared to the Lamborghini-like evidence pointing to a top now; a Lamborghini powered by a flux capacitor!
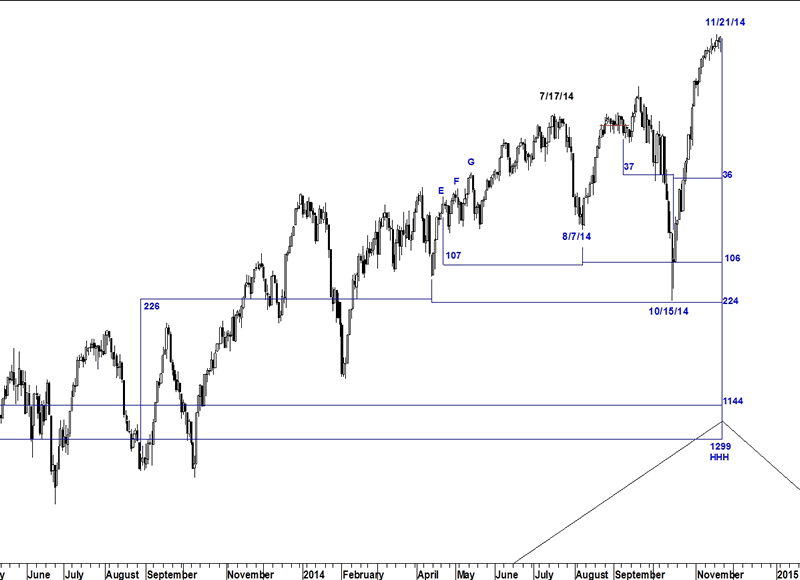
The Sept 9 breakdown from a flattened top counts 37 days to the low on Oct 15. 37 days later is Saturday, Nov 22.
Lindsay wrote of a 107-day short-term interval which points to market tops. Counting 107 days from the low on Aug 7, points to a top near Nov 22. In addition, point E on Apr 22 of an ascending middle section counts 107 days to the Aug low which then forecasts a high on Nov 22.
Lindsay's other short-term interval was 222 days (221-226). This interval points to both highs and lows. In this case we have a chain of intervals that begins at the Aug 2013 low and counts 226 days to the Apr 2014 low. The April low then counts 224 days to Nov 21.
Point E on 8/15/08 of a descending middle section counts 1,145 days to the low of the basic cycle on 10/4/11. 1,145 days later is Nov 22.
The high of the first multiple cycle (10/11/07) counts forward 1,299 days to the high of the first basic cycle (second multiple cycle) in May 2011. 1,299 days later is Nov 21 creating a potential high-high-high pattern.
In addition there are middle sections centered on the low of the long cycle (10/10/02), the basic cycle (3/6/09), and the Oct 2004 low which point to Nov 21 and 22 (not shown).
The bullish seasonality of this week's US Thanksgiving week holiday could keep equities aloft for a few more days but once the high is in our rear-view mirror, well, in the words of Doc Brown "Where we're going, we don't need roads."
Try a "sneak-peek" at Lindsay research (and more) at Seattle Technical Advisors.
Ed Carlson, author of George Lindsay and the Art of Technical Analysis, and his new book, George Lindsay's An Aid to Timing is an independent trader, consultant, and Chartered Market Technician (CMT) based in Seattle. Carlson manages the website Seattle Technical Advisors.com, where he publishes daily and weekly commentary. He spent twenty years as a stockbroker and holds an M.B.A. from Wichita State University.
© 2014 Copyright Ed Carlson - All Rights Reserved
Disclaimer: The above is a matter of opinion provided for general information purposes only and is not intended as investment advice. Information and analysis above are derived from sources and utilising methods believed to be reliable, but we cannot accept responsibility for any losses you may incur as a result of this analysis. Individuals should consult with their personal financial advisors.
© 2005-2022 http://www.MarketOracle.co.uk - The Market Oracle is a FREE Daily Financial Markets Analysis & Forecasting online publication.