


HUI Closes Strong – Gold Price Clears First Resistance Hurdle
Commodities / Gold and Silver Stocks 2015 Jan 13, 2015 - 06:48 AM GMTBy: Dan_Norcini

 Two quick charts to note some developments in gold.
The first is of the metal itself.
A couple of things worth mentioning. First of all is the CLOSING push past the 100 day moving average. That will attract the technical or chart-based trading funds. If they are short, they will cover; if not long, some will come in on a signal like this.
Secondly – the price closed above the first level of chart resistance noted down near the $1225 level or so. That is the best CLOSING price in over one month.
Also, the price managed to push into, but not through so far, the second resistance zone noted on the chart. That extends up to $1240. A push through that level that can stay above it, should allow the market to make a run at $1250. Clearing that would be a big deal in my view as it would open the potential to run at least another $25 higher to the area near $1275 and possibly even $1290-$1300.
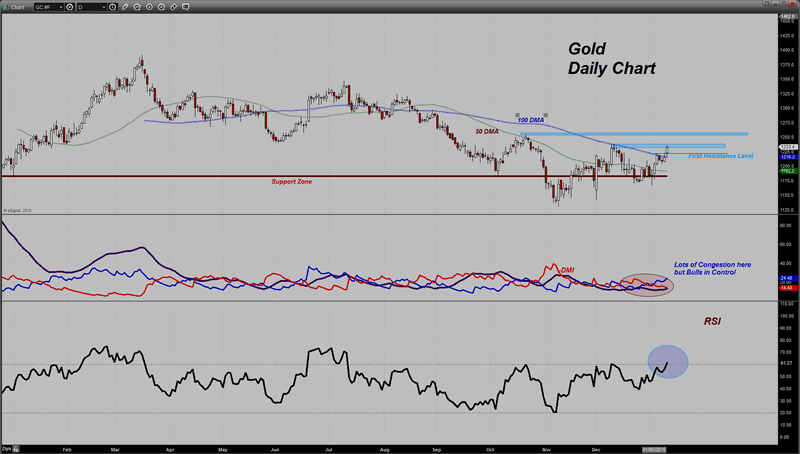
Also, the RSI has now finally moved through the key 60 level, something it has not done since July of last year. If the RSI can extend higher tomorrow or the next day, and actually get above 65, this recent move higher would have to be respected as having some more upside potential.
Personally, I am still not excited about gold based on my current view of the fundamentals as I see little reason to own it for any sort of decent returns in the long term, but in this environment in which stocks are wobbly right now and interest rates are falling, it is definitely attracting safe haven flows as is witnessed by the falling yield on the Ten Year Treasury note and the move higher in the long bond ( as well as Yen strength). In other words, while the intermediate term chart, the weekly, looks poor, the Daily chart has definitely improved. Short term I see nothing on this chart to induce me to be bearish its prospects for the current time being – yet…
That being said, one cannot fight the tape and expect to win so if you are short, keep a close eye on this as a fairly good contingent of short positions are covering right now.
One of the other positive factors for the metal at the moment is the strength in the gold shares. The HUI looks very impressive on the chart right now, again, the DAILY CHART. It too has cleared its 100 day moving average, something which it has not done since September of last year. Also the 50 day is turning higher.
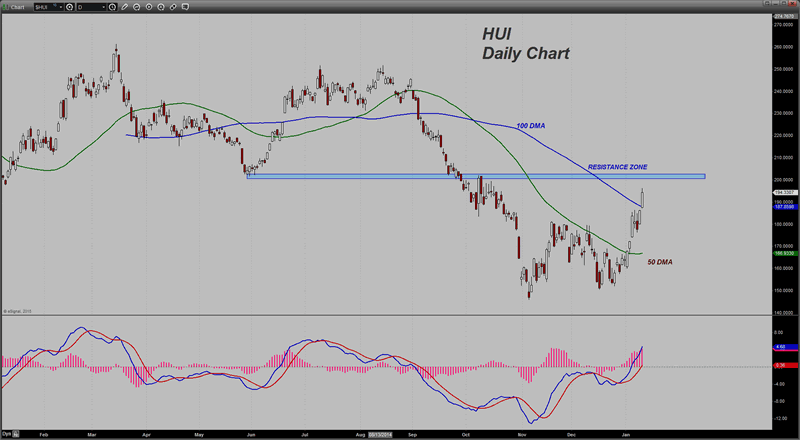
Note that there is what appears to be a solid band of resistance over the market near the 200 level. That will be a bit test for the bulls in my view.
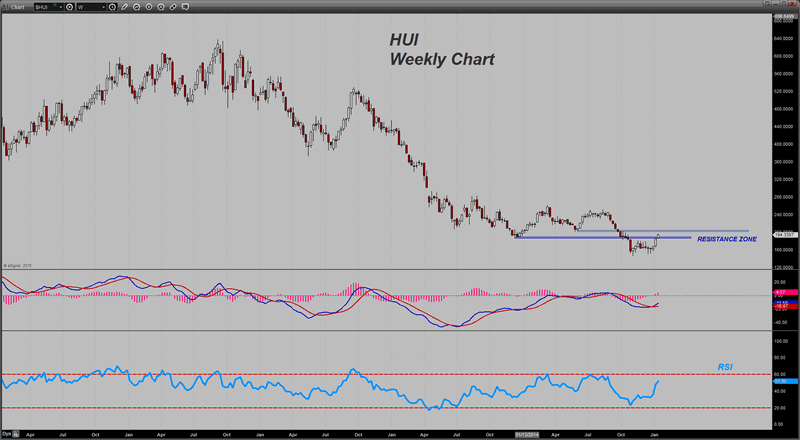
Switching out to a longer term view ( intermediate or weekly chart), the index has pushed past the top of the first resistance zone noted on this chart. That extends back to the December 2013 /October 2014 lows. If the HUI can maintain its gains until the close of trading this Friday, it stands a good chance of moving higher and possibly making a potential run at 200-210.
I should note however that on this longer-dated time frame, the RSI is currently showing a BEAR MARKET RALLY is occurring at this point. That is because the reading is well below 60 ( currently near 52). As you can see from looking across at the indicator, it has not been above 60 since October 2012!
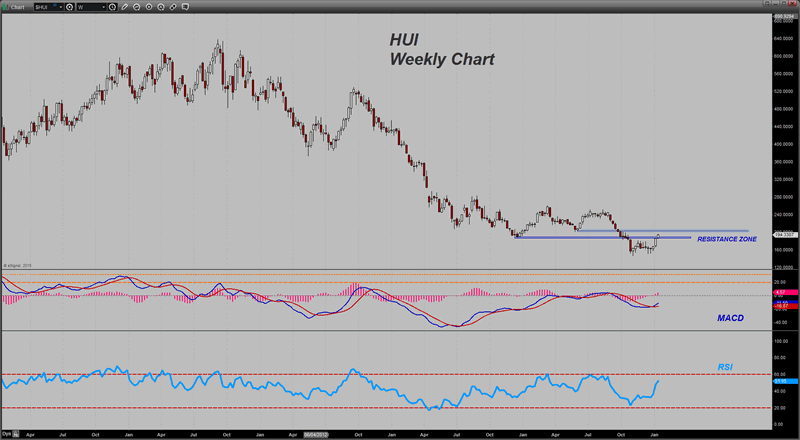
The MACD is positive reflecting the bullish view but the reading is also quite depressed even though it is indeed in a bullish posture. I have drawn in some dotted/dashed lines in orange on that indicator to give you some examples of what the MACD looks like when it is reflecting some bullish readings. I try to combine these two indicators to give me a sense of the strength of any market move. Back in September 2012, the MACD was strongly bullish and the RSI has moved above 60, reaching to 67 at that time, giving the possibility of a resumption of the bull move. Note how quickly the RSI fell back below the 60 level. It was only a few weeks later that the MACD threw off a new SELL signal. The market then proceeded to implode lower.
That is the reason one wants to employ a few good indicators ( I have not even included the ADX/DMI on this chart) along with various horizontal support and resistance levels, to analyze a market. As far as I am concerned at this time, until the WEEKLY RSI can register a reading above 60 in this market, this appears to be nothing more than yet another move higher in an ongoing bear market in the gold shares. Short term (Daily chart) the HUI is promising; longer term it is not. Not yet…
I will make this comment and leave it at that… some of the readers are still holding large numbers of mining shares in their portfolios from having bought them a few years back at the height of the gold bug “the sky is falling” hysteria. I would watch this intermediate term chart very closely if you are considering lightening any of that load and trying to salvage what is left of a financial disaster that occurred in these shares. Right now, at this moment, there is still upside momentum on display. Keep a close eye on that because if that momentum changes to the downside and the rise stalls out, it might present you with an opportunity to sell some of your holdings in this sector and set aside some cash to buy into a different sector later on these next few weeks/months. Don’t try to predict anything – just watch the price action carefully and buy and sell based on what you see in the price chart action.
The reason I bring this up is that I know from emails in the past that many, many readers of my former site had swallowed the propaganda from the gold perma bulls and loaded the boat on gold mining shares. Having watched their financial net worth devastated as a result of listening to those Johnnie One note hucksters, they are now stuck with large holdings of the things in their portfolios. If the market gives you a chance to sell some of those losers at a better price AND IF YOU believe you are overloaded in gold shares, then watch the current rally closely as it may be just what the Doctor ordered for you to relieve some of your pain in there.
I remember how stunned I was to first learn that some of the poor victims of these gold shills sold every stock that they had while waiting for the “any day now market crash” and took the entire proceeds and put them into gold shares! The results of that were of course horrendous. I know of two instances in which marriages were ruined as a result of this sort of “bet the farm on a sure thing” crap.
The lesson in this is hard but simple – when trading or investing PRECIOUS INVESTMENT CAPITAL DO NOT listen to emotional or fear-based ideas. Instead, do your own analysis and STUDY THE PRICE CHARTS. You will never go wrong by listening to what the market tells you.
That goes for anything yours truly here might tell you! Like any other trader, I have my own idea of what a market should be doing from my understanding of the fundamental factors that impact it. Guess what – I can be wrong as well! We all can. That is why it takes humility and a lack of ego when trading. Admitting you are on the wrong side of a trade or investment is incredibly easy unless you have an ego problem. If you are wrong, GET OUT! You can always get back in but not if you have lost all of your money by refusing to admit that the market is not confirming your opinion towards it.
Dan Norcini
Dan Norcini is a professional off-the-floor commodities trader bringing more than 25 years experience in the markets to provide a trader's insight and commentary on the day's price action. His editorial contributions and supporting technical analysis charts cover a broad range of tradable entities including the precious metals and foreign exchange markets as well as the broader commodity world including the grain and livestock markets. He is a frequent contributor to both Reuters and Dow Jones as a market analyst for the livestock sector and can be on occasion be found as a source in the Wall Street Journal's commodities section. Trader Dan has also been a regular contributor in the past at Jim Sinclair's JS Mineset and King News World as well as may other Precious Metals oriented websites.
Copyright © 2015 Dan Norcini - All Rights Reserved
All ideas, opinions, and/or forecasts, expressed or implied herein, are for informational purposes only and should not be construed as a recommendation to invest, trade, and/or speculate in the markets. Any investments, trades, and/or speculations made in light of the ideas, opinions, and/or forecasts, expressed or implied herein, are committed at your own risk, financial or otherwise. The information on this site has been prepared without regard to any particular investor’s investment objectives, financial situation, and needs. Accordingly, investors should not act o
© 2005-2022 http://www.MarketOracle.co.uk - The Market Oracle is a FREE Daily Financial Markets Analysis & Forecasting online publication.