


Gold And Silver - Around The FX World In Charts
Currencies / Forex Trading Jan 27, 2015 - 12:21 PM GMTBy: Michael_Noonan

 There has been some discussion about how the Swiss National Bank breakaway from the 1.20 peg to the Euro was a shot to the upside for gold. It appeared to us that the rally may have been sparked a few days ahead of the announcement, and last week's mostly sideways aftermath was the froth on the rally. It may continue, but the narrower range could just as well lead to a pullback, discussed in last article, Timing Is The Most Important Element, [paragraph above each weekly chart of silver and gold].
It made sense to compare the leading currency charts on the Foreign Exchange markets [FX], to see a) does a correlation exist, and b) take an overview of a market we rarely visit. As the SNB decision to make an apparent[?] independent break from the rest of the central banks, the risk exposure in trading in the bank-[rigged]-dominated FX markets is far greater than any occasional rewards.
Here are the weekly gold and silver charts as a comparative reference to the FX charts reviewed:
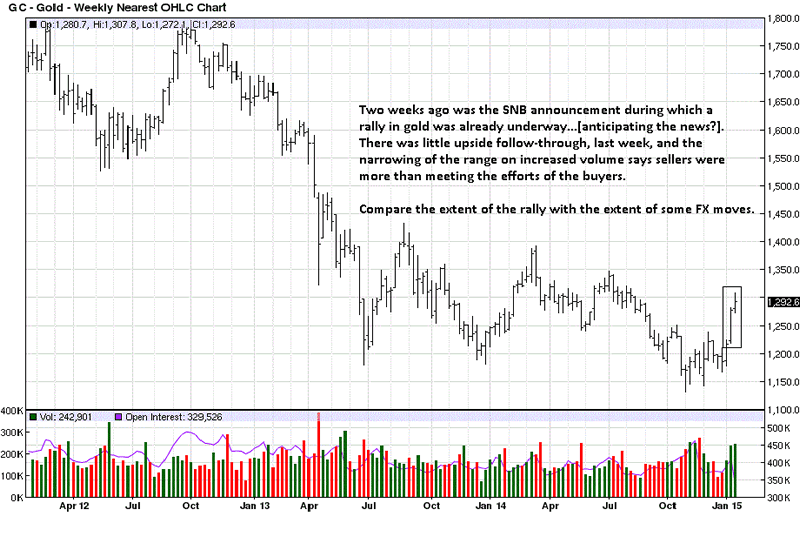
Two bars ago was when the Swiss National Bank [SNB], made its announcement, on the last day of the week, Friday, to cut loose from the 1.20 euro peg. Price had already rallied prior to Friday, and that may be reflective of the "insiders" positioning for the news event. Whether that is true or not does not really matter. More interesting is how last week was a much smaller bar range, after the news was out. It tells us sellers were active keeping buyers from extending the rally any higher. One implication is short-term profit taking into the public buyers who want to get in before they "miss the move."
You will see the difference of last week's small range for gold v the same week for each fiat currency reviewed.
Keep in mind, an ounce of gold is an ounce of gold. It never changes. What does change is the number of fiat units it takes to purchase the same ounce. For example, gold does not go up in value relative to the declining euro, rather it takes more and more euros to purchase one ounce, the ounce of gold being a constant, as is true for silver.
On the other hand, the fiat dollar has been rising in imaginary "value," which means it requires less fiat units to purchase the same ounce of gold. The irony should escape no one that the country with trillion-dollar annual deficits, with a question as to whether any physical gold exists, and no industry from which to grow, aka the United States, is the one country recently stronger than gold. There are few who do not know this has been due to active manipulation of gold for decades. That is soon to change. [Soon is relative.]
Gold - Weekly Nearest OHLC Chart
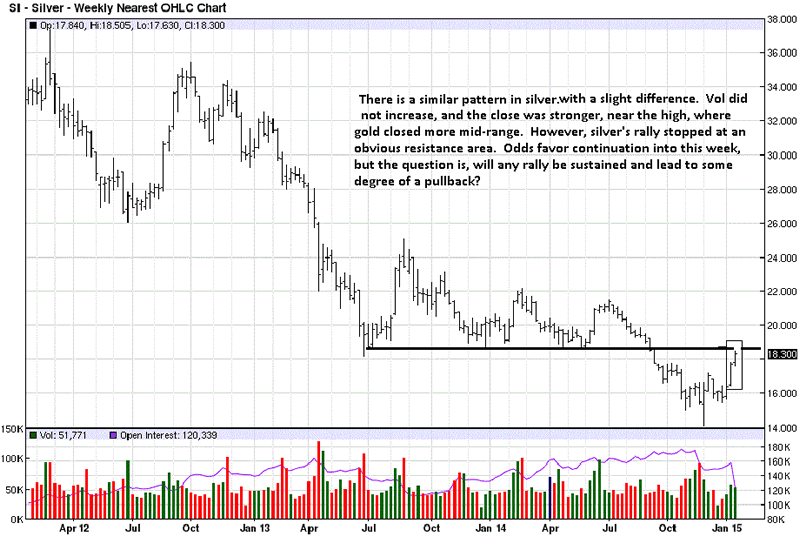
We are seeing a change in price behavior in both silver and gold, and for the past few weeks, the gold silver ratio has come in from 74-75:1, the number oz ounces of silver equal to an oz of gold, to just over 70:1, indicating silver is performing a little better relative to gold. This is happening as the probability of a bottom in the PM market is growing, but yet to be confirmed, and we have stated silver can outperform gold.
Silver - Weekly Nearest OHLC Chart
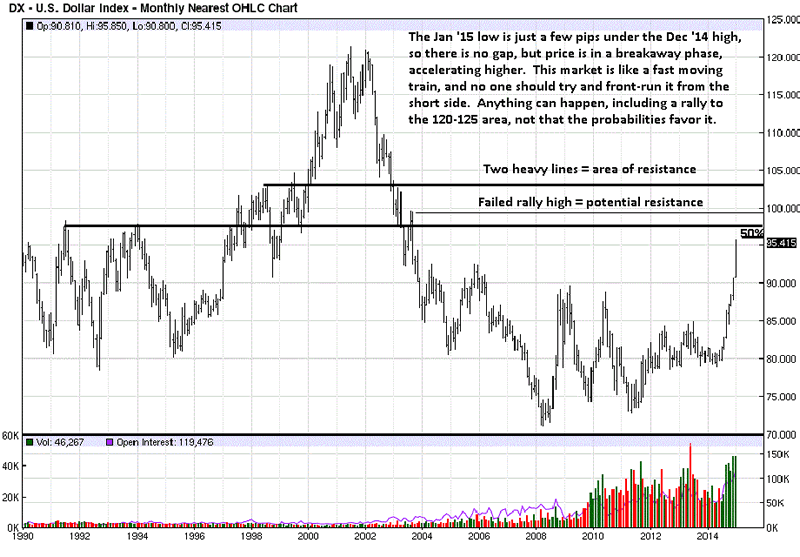
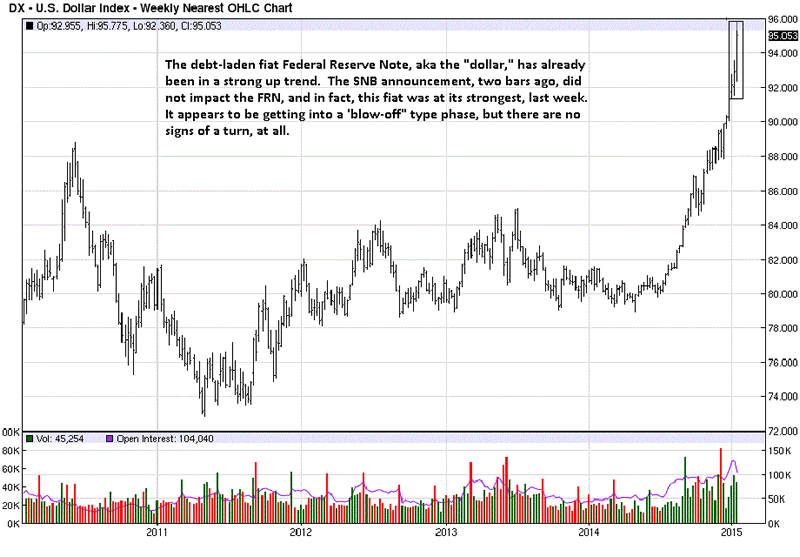
Here is the bully fiat currency with absolutely zero intrinsic value, rallying strongly for 7 consecutive months of higher lows and very little overlap on bars, a sign of strength. It is only the elite's Western central bankers that keep saying gold has no intrinsic value, and it doesn't earn interest. No mention has been made that more and more fiat currencies have gone negative, charging customers to hold fiat cash in any of the insolvent banks, and they are ALL insolvent.
Russia has a vast accumulation of physical gold, and it is the richest country in the world for natural resources. Where the US is choking on $18 trillion in debt that it can never repay, Russia has very little national debt. Why is the US fiat Federal Reserve "dollar" rising while the Russian ruble has been declining? One answer: military might with the US threatening actual war and/or economic war against any country opposing use of the "dollar" as the world's reserve currency, which is fast losing that status in almost every nation.
The Wizard of Oz lives on, for now. Too many countries are looking behind the US curtain, recognizing the fraud and choosing to do something about. Like the SNB apparently snubbing the Western banking system, as a maybe, but for sure is saying to the US, "No mas!"
US Dollar Index - Monthly Nearest OHLC Chart
It is mostly against the fading military might of the bully tactics of the Fed that gold has not held its own. All we can say is, change is in the air, everywhere, and the US is on its last leg. One cannot bet against the worthless fiat "dollar" for now, but it is a sure bet that gold will prevail, once again, as it has against other currencies, as true money.
In another bit of irony, by established law, still on the books in the US, gold and silver are the only legitimate forms of money. Federal Reserve Notes have no basis as lawful money, except by a de facto coup by the moneychangers who forced through the Federal Reserve Act of 1913. U S citizens do not pay attention to history and do nothing about the coup.
US Dollar Index - Weekly Nearest OHLC Chart
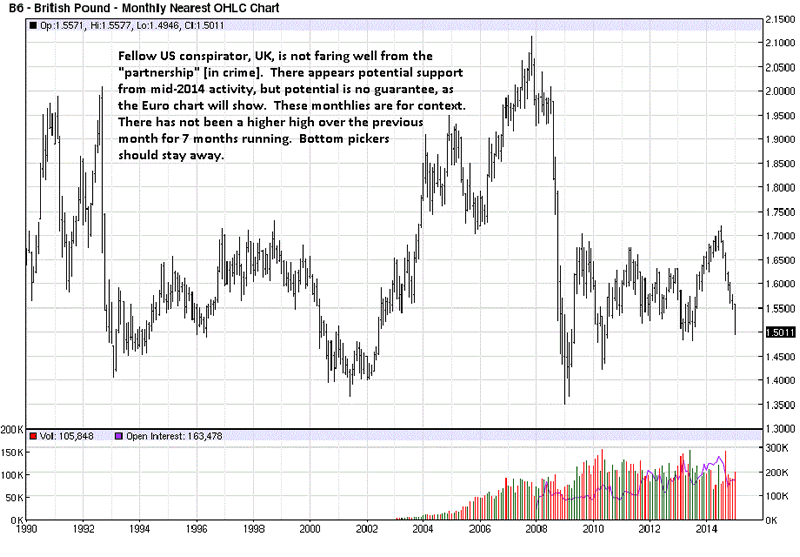
Partner in crime with the US, which has seen its fiat rise for 7 months, the UK pound has declined for 7 straight months of lower highs. It takes increasing more pounds to buy an ounce.
British Pound - Monthly Nearest OHLC Chart
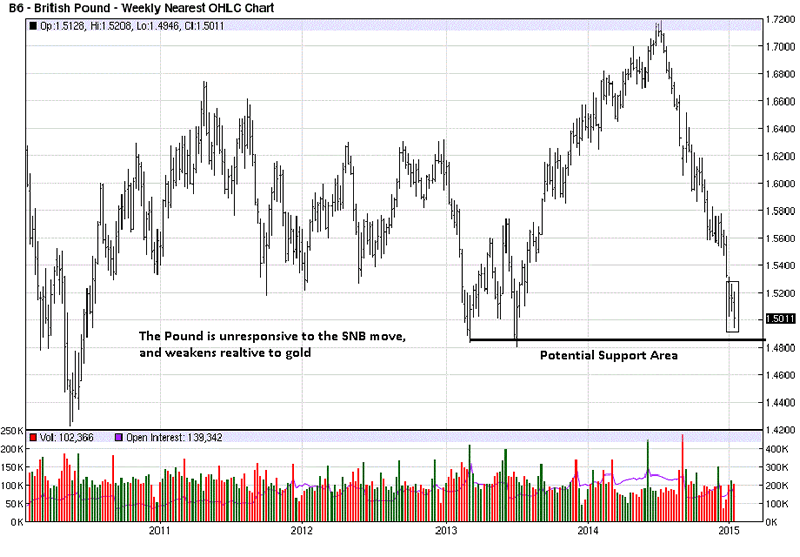
Last week declined after a few overlapping bars as price approaches what could be a support area, and it may hold, but one needs to be aware of how the euro failed to hold its apparent potential support.
You have to watch how price reacts to a support or resistance area and not just blindly expect it to hold. Compare how the euro acted as it approached potential support and how the Swiss franc responded at its potential support, [the last 2 sets of charts]. It may help to better understand if the pound will hold or fail.
British Pound - Weekly Nearest OHLC Chart
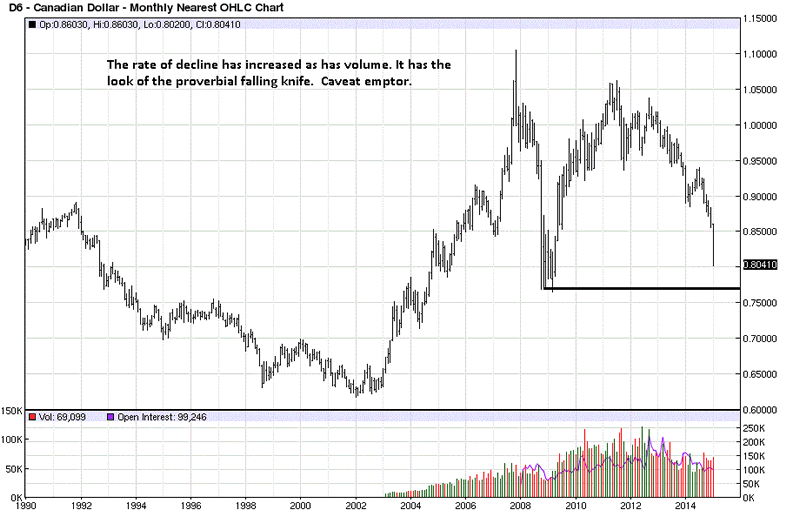
Obviously, the C-dollar is fading, relative to gold, in recognition that paper fiat is what it is: a massive Ponzi scheme promoted by the elite's central banking system designed to steal every nation's wealth. Most people have still not woken up to this reality. There is the expression, "Seeing is believing," but for some reason it fails notice in the Ponzi banking system.
Canadian Dollar - Monthly Nearest OHLC Chart
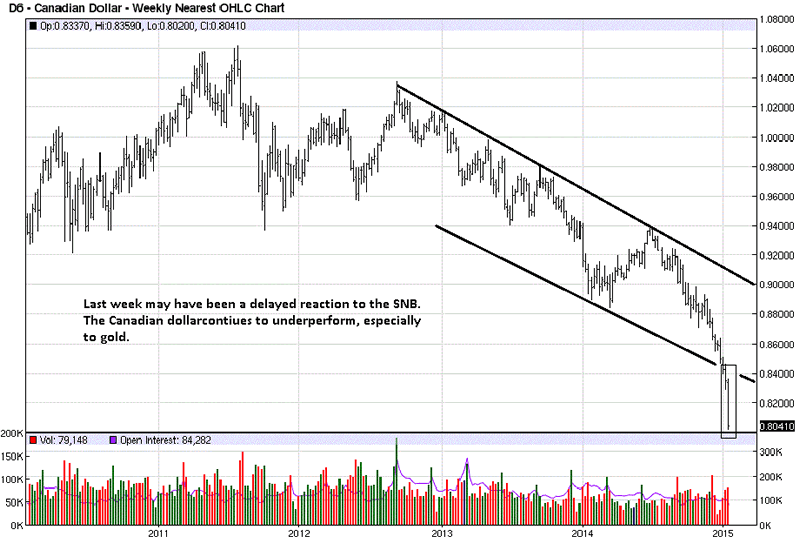
A more graphic picture of how the action of the SNB, in rejecting the Ponzi fiat system, had it impact on the fast-declining C-dollar.
Canadian Dollar - Weekly Nearest OHLC Chart
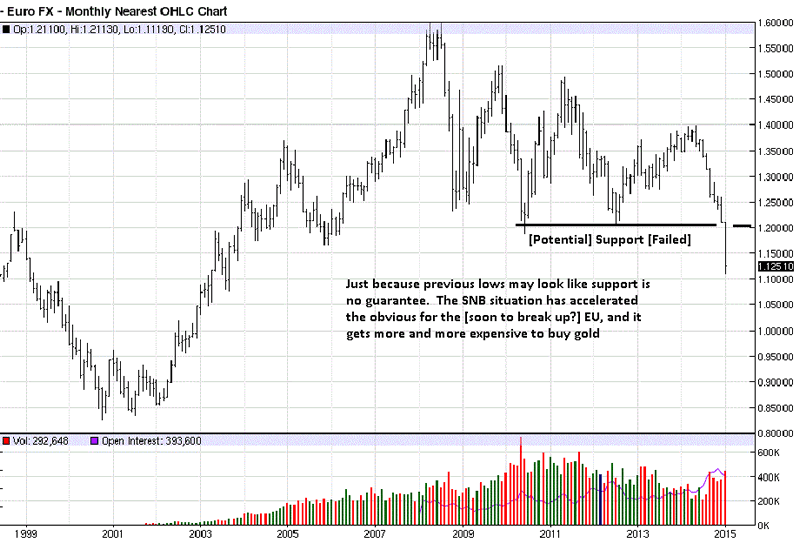
As the euro approached potential support, there was no stopping it, no pause to see if it would hold, and it did not. The SNB saw the same thing and realized it would be economic suicide to remain a player on the Kabuki fiat theater stage. Exit left, SNB.
Euro FX - Monthly Nearest OHLC Chart
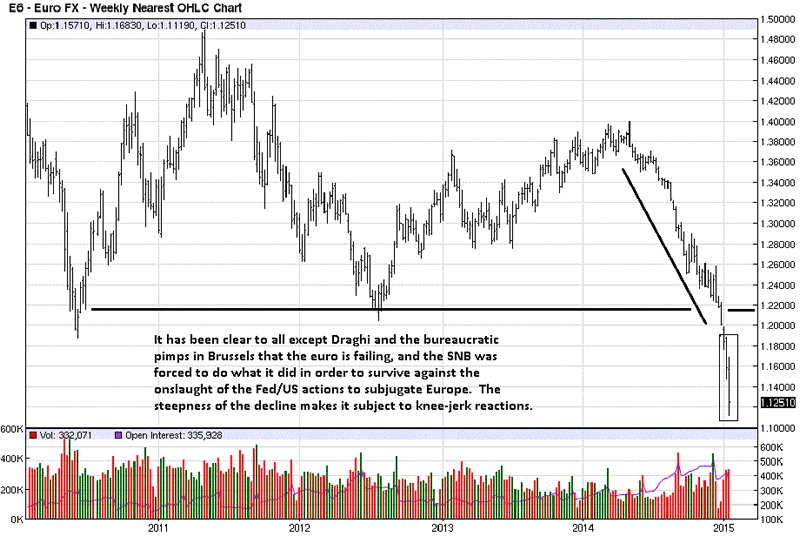
A more detailed sinking of the SS Euro. The Swiss did not want to suffer the same fate, plain and simple.
Euro FX - Weekly Nearest OHLC Chart
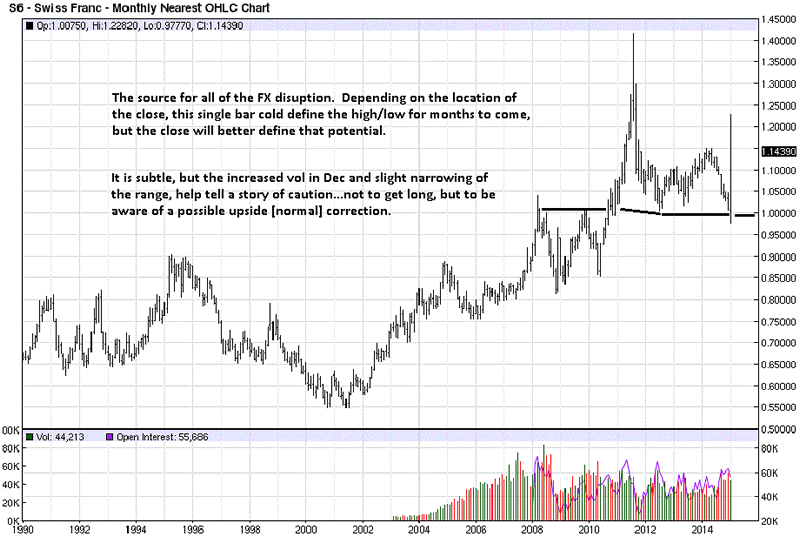
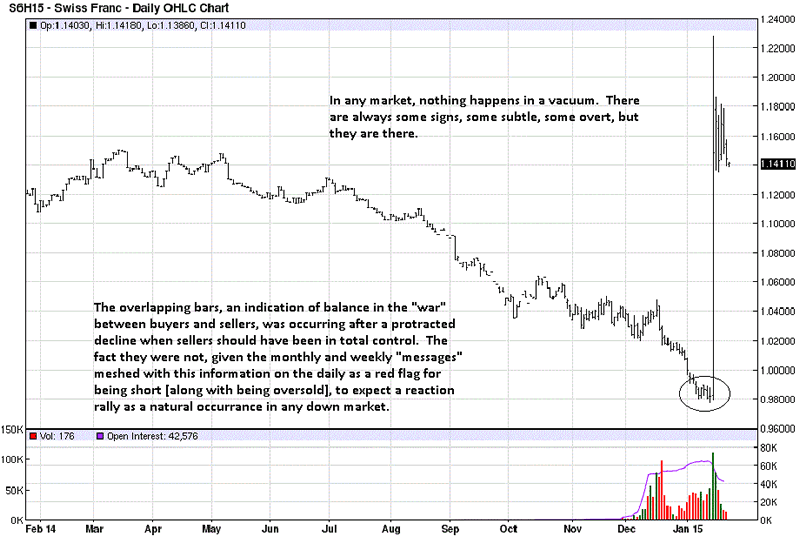
To the prime actor, the Swiss franc reflecting the actions of the SNB. We have made comments on the charts that left clues to be wary of the short side, which in no way implies the stated clues foretold the 30% jump that followed. Rather, the comments are how markets advertise their intent. Sometimes it is more obvious than at other times, but the signs are there.
Swiss Franc - Monthly Nearest OHLC Chart
We had kept an eye on the franc since the Swiss failed gold referendum in November, and we could see reasons for not wanting to be short, but it was from the cheap seats where we had no skin in the game. Each lower time frame was evolving in a way that echoed the same message: this market could have a natural reaction higher. That was the extent of our thinking.
Swiss Franc - Weekly Nearest OHLC Chart
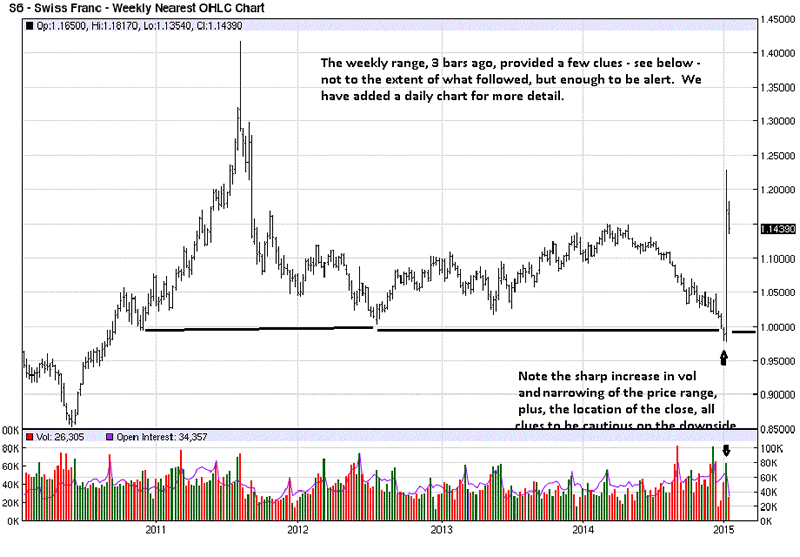
Here you can see the clincher: almost 6 straight days of smaller range overlapping bars. We are on record enough times in the past mentioning what overlapping bars signify. It is for reasons like this why we continue to say how charts, specifically in the form of a price/volume relationship, provide the best and most reliable market read.
Given all of the news, and now the reaction of the SNB rejecting the fiat system, it is more important than ever to recognize the wisdom of holding physical silver and gold. Just like the Swiss franc jumped 30% in value overnight, at some point, the same can happen with gold and silver.
That is your take-away message.
By Michael Noonan
Michael Noonan, mn@edgetraderplus.com, is a Chicago-based trader with over 30 years in the business. His sole approach to analysis is derived from developing market pattern behavior, found in the form of Price, Volume, and Time, and it is generated from the best source possible, the market itself.
© 2014 Copyright Michael Noonan - All Rights Reserved Disclaimer: The above is a matter of opinion provided for general information purposes only and is not intended as investment advice. Information and analysis above are derived from sources and utilising methods believed to be reliable, but we cannot accept responsibility for any losses you may incur as a result of this analysis. Individuals should consult with their personal financial advisors.
Michael Noonan Archive |
© 2005-2022 http://www.MarketOracle.co.uk - The Market Oracle is a FREE Daily Financial Markets Analysis & Forecasting online publication.